Volatility Regime
Probability Analyzer
Understand the probability distributions of asset movements. Our heuristics classify candles into Sideways consolidation, Trendy momentum, or Volatile wicks, helping you avoid trade traps.
Isolate Volatility Regimes
Trading strategies fail when deployed in wrong market regimes. Momentum setups lose money in sideways consolidation; options writing loses money in sudden trend breakouts.
Our backtester crawls daily candles and calculates volatility indicators. It identifies the optimal active trading hour and suggests sizing configurations dynamically.
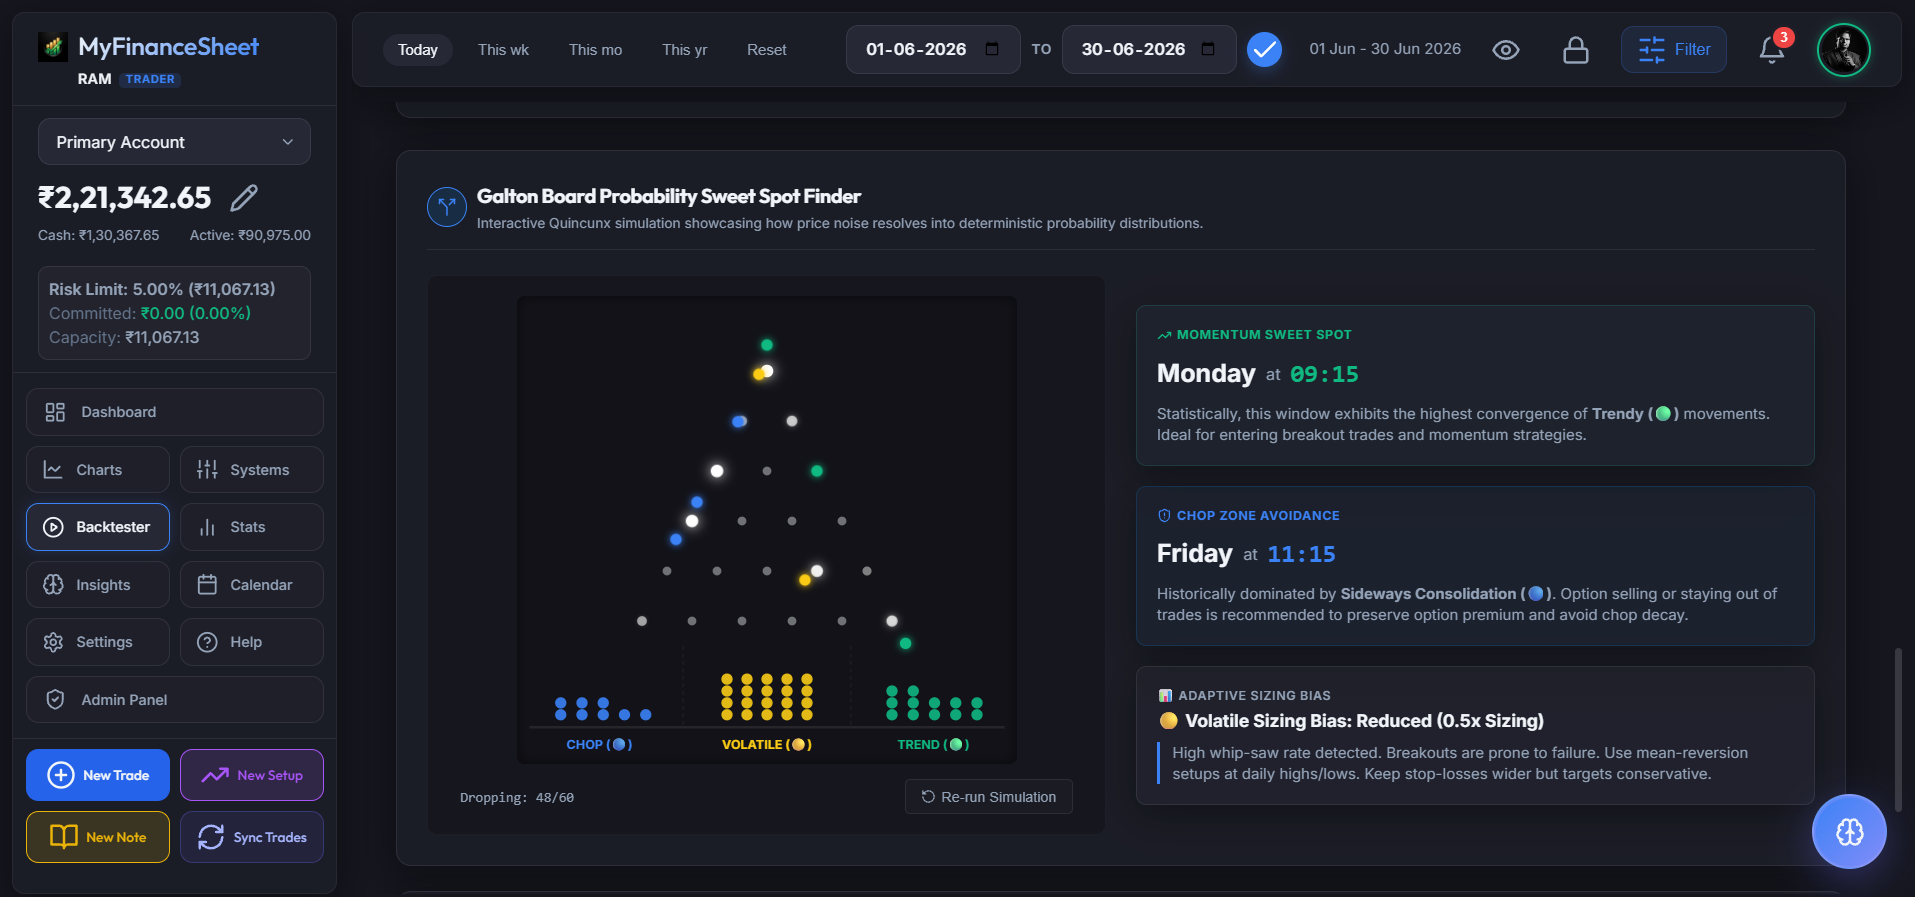
Galton Board Simulation
Visualizing probability distribution of market phases.
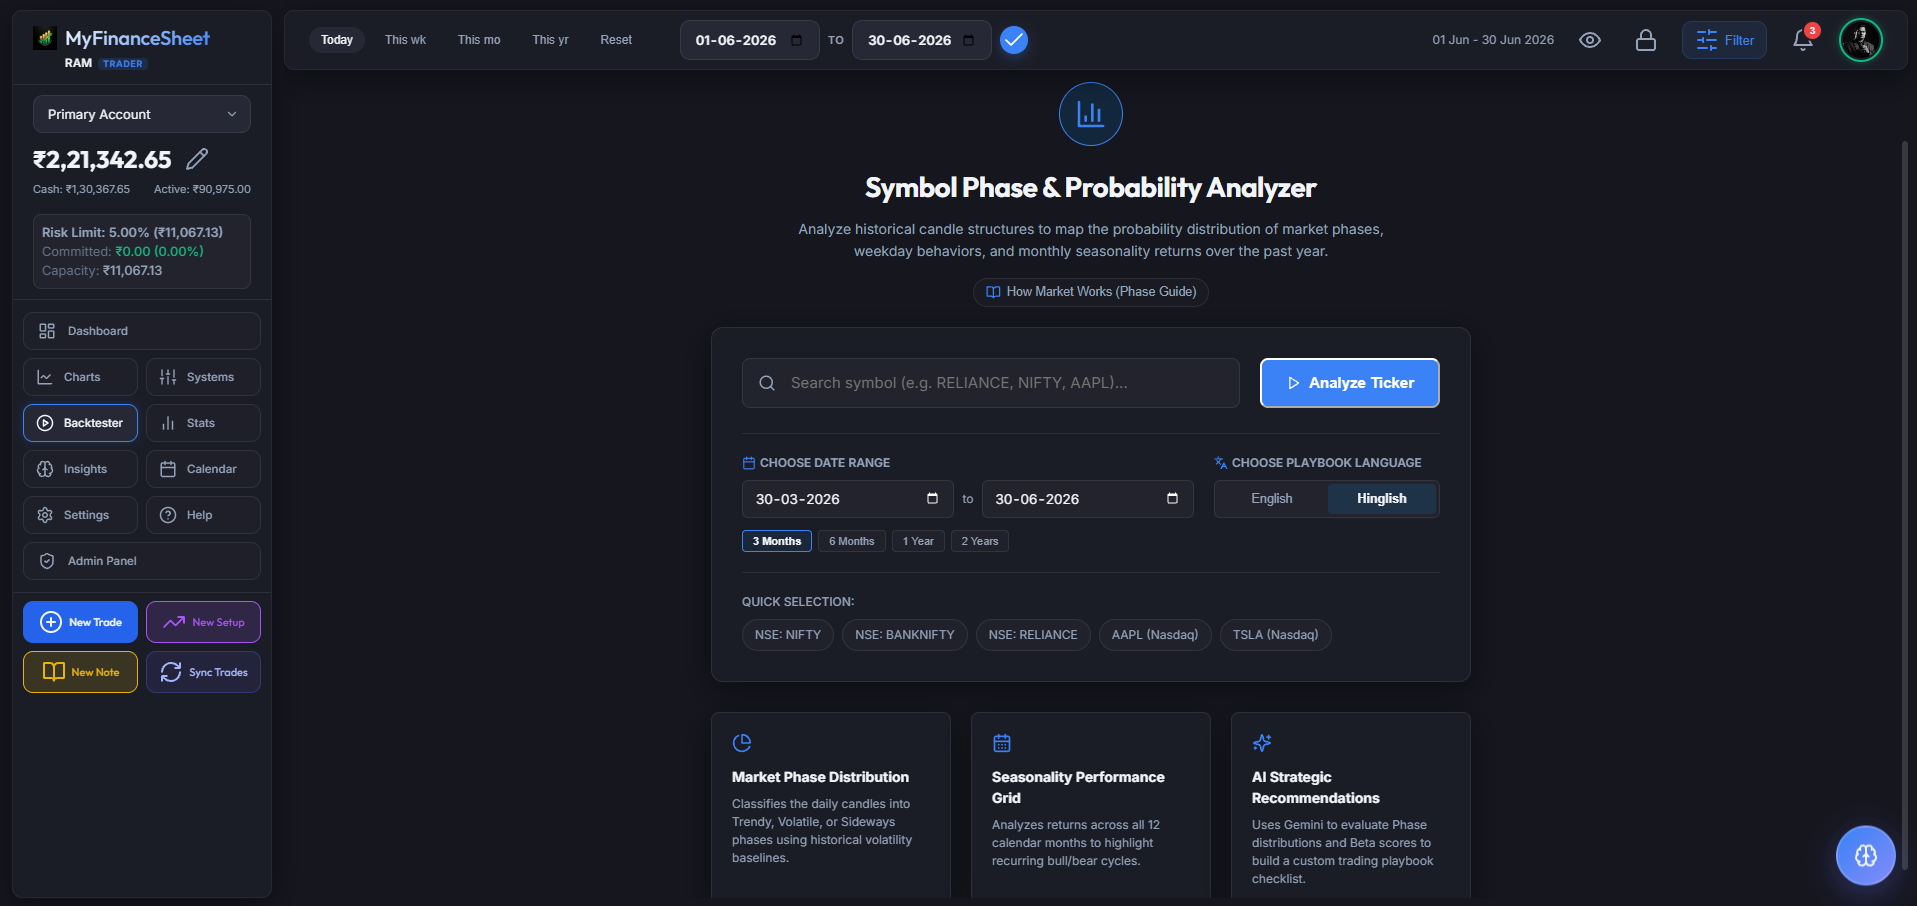
Probability Analyzer Dashboard
The landing interface of the Probability Analyzer. Translates ticker names (preserving carets for Indian indices like ^NSEI and ^NSEBANK) and processes daily candles fetched via our CORS-bypass local proxy (/api/yahoo).
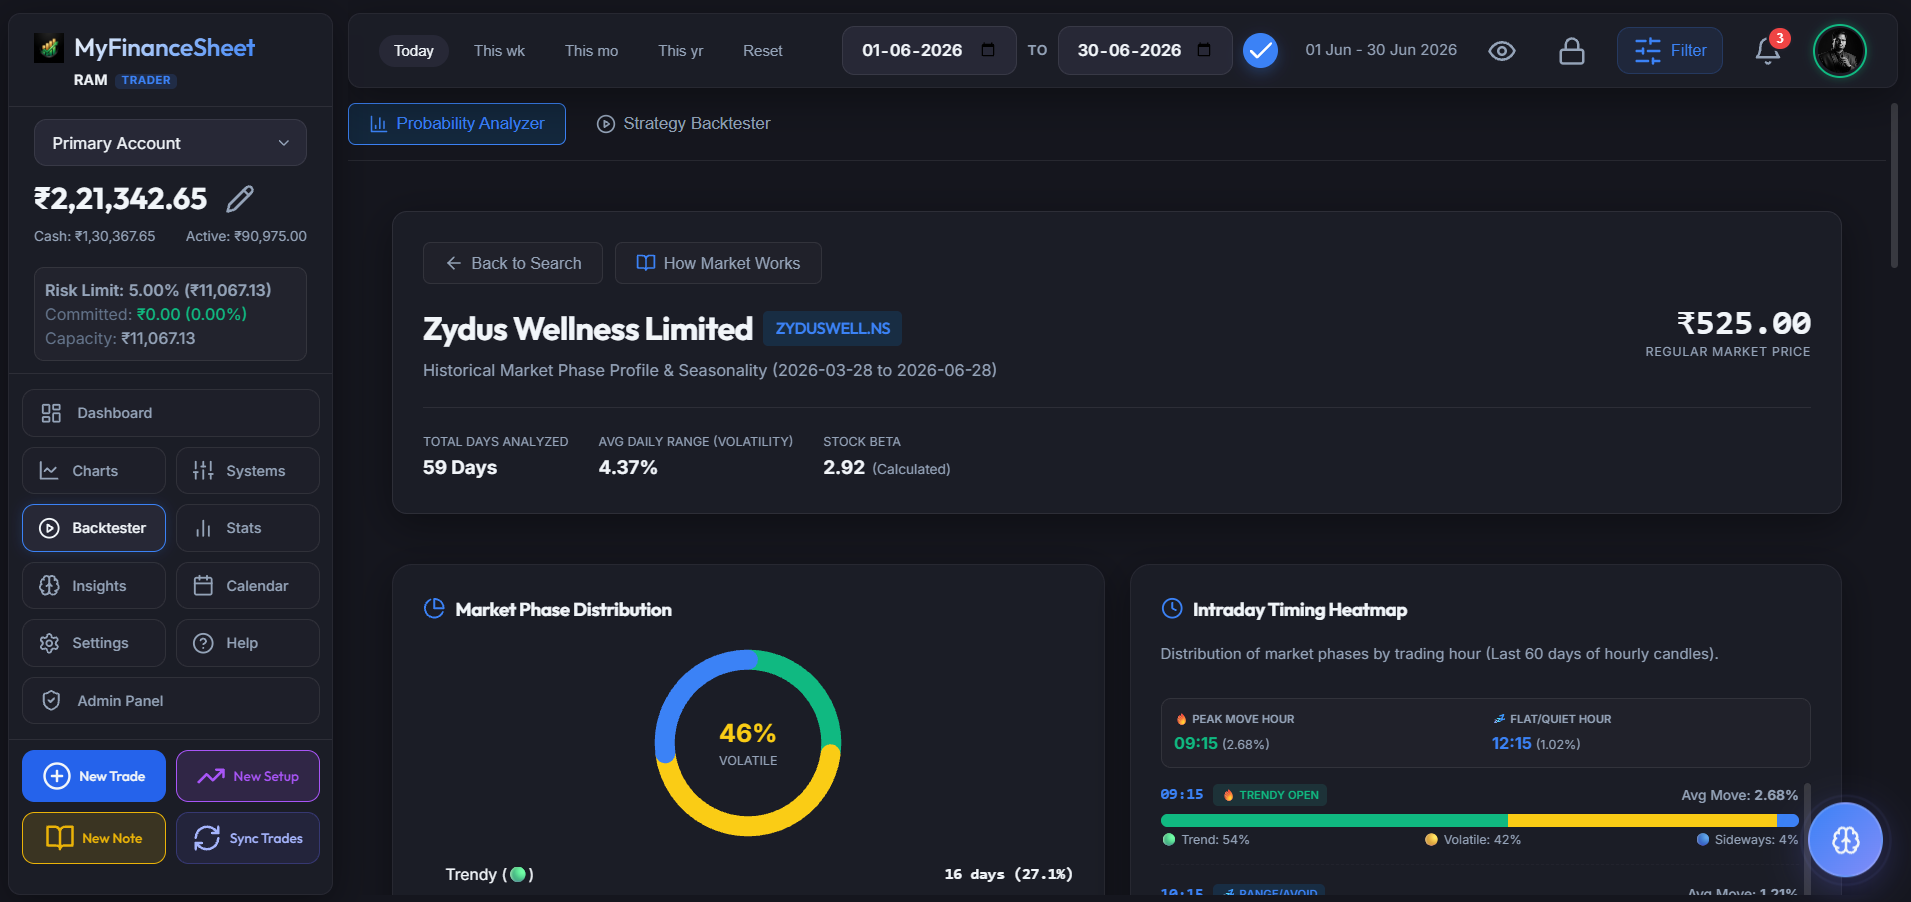
Quantitative Regime Classification
Analyzes daily price history and runs volatility heuristics to classify candles into Sideways (🔵), Trendy (🟢), or Volatile (🟡). Uses formulaic rules comparing daily high-low ranges to average historical volatility.
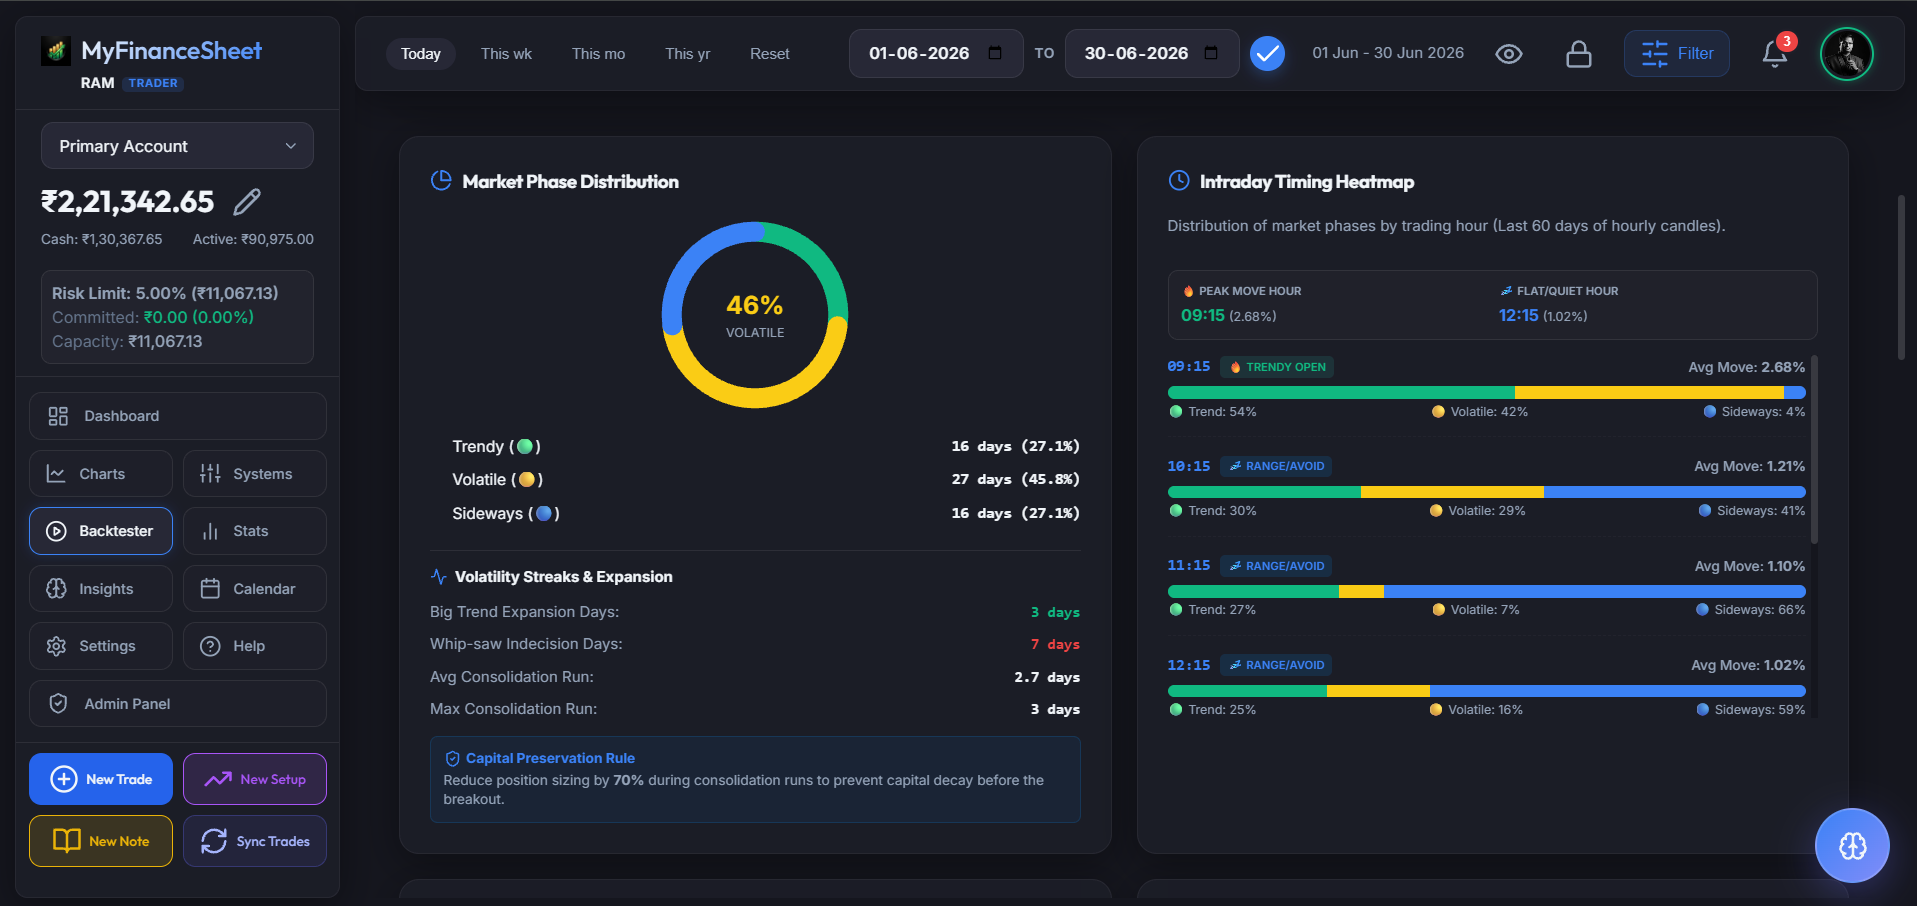
Historical Regime & Hourly Distribution
Plots a breakdown of the percentage distribution of each market regime over the 6-month historical lookback period, alongside the Intraday Timing Heatmap showing phase probability by hourly slots.
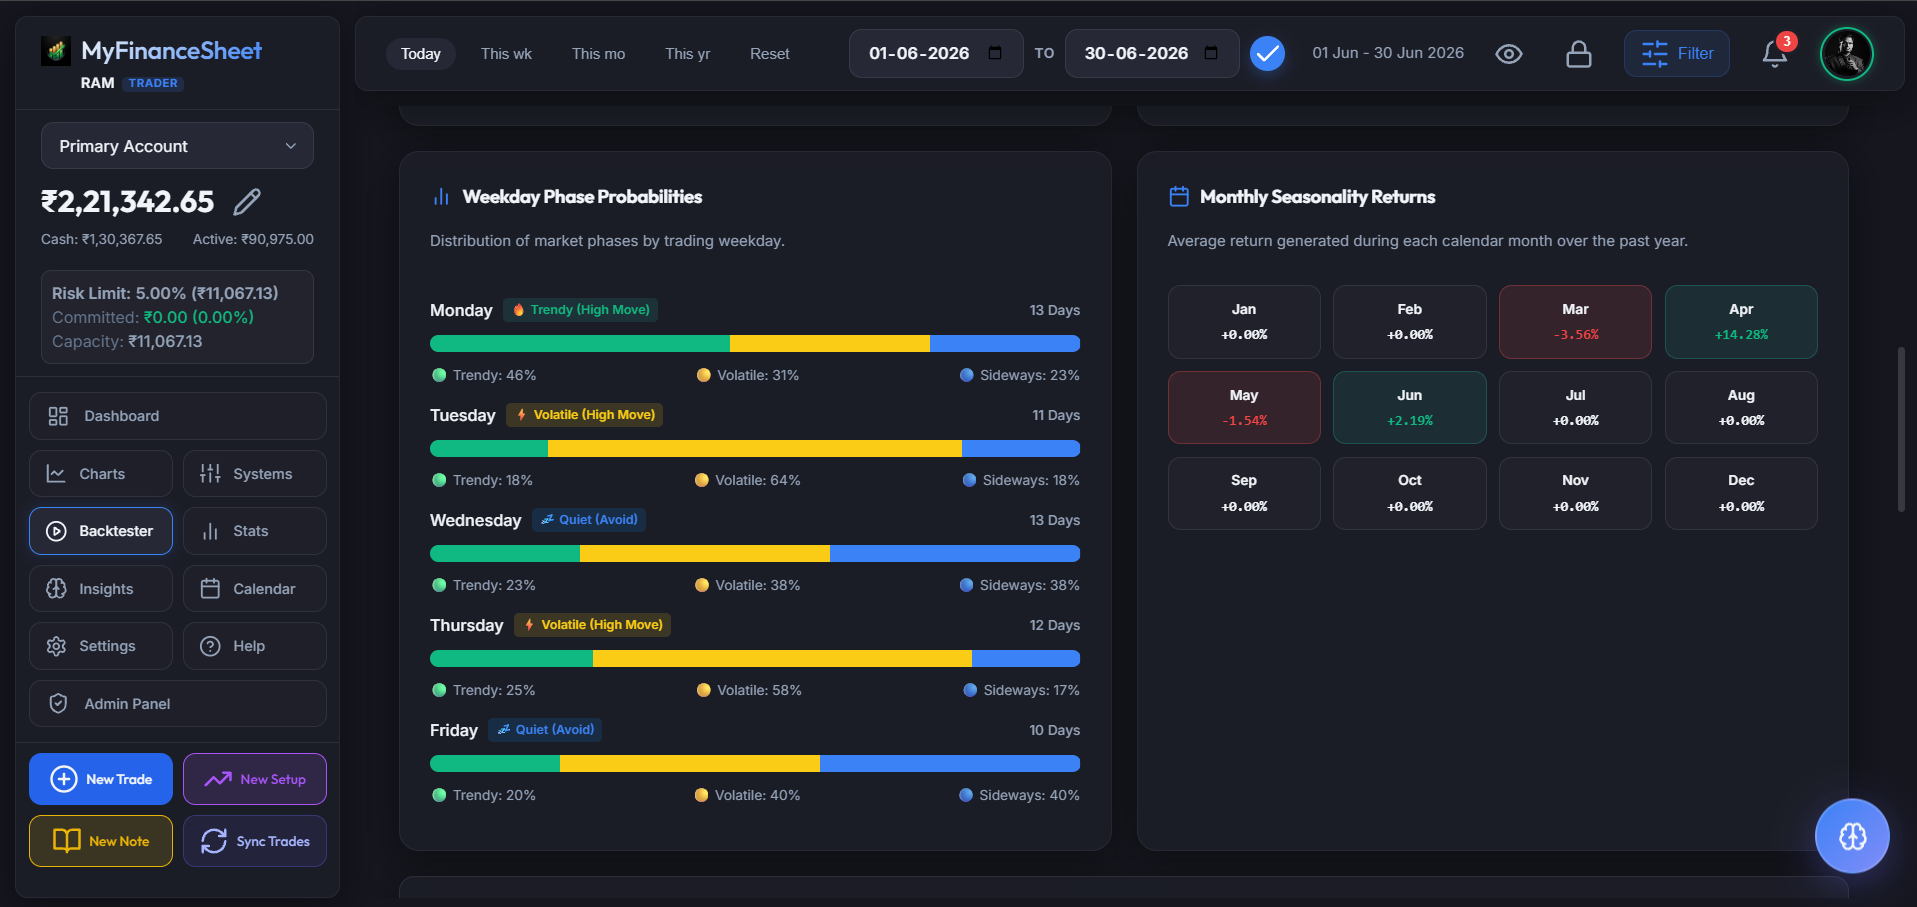
Weekday Phase & Seasonality Returns
Analyze phase probability by trading weekday (e.g., Trendy Mondays vs. Sideways Fridays) alongside monthly seasonality returns over the past year.
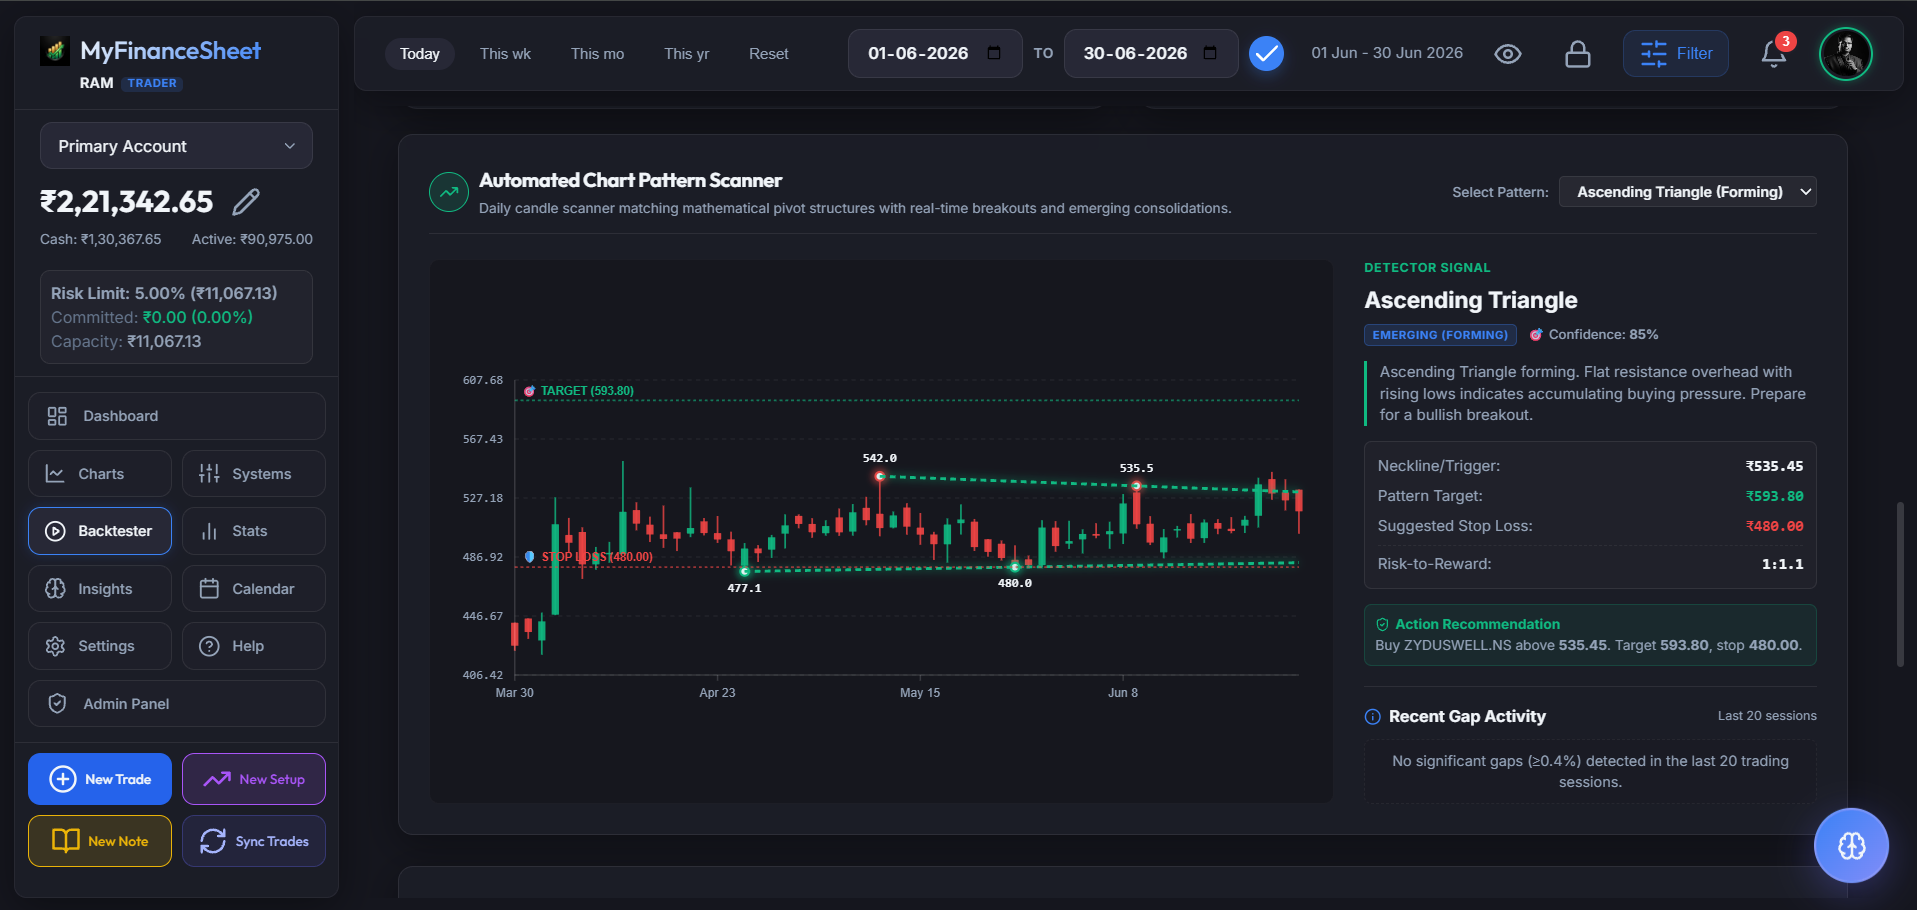
Automated Chart Pattern Scanner
Scans historical daily candles and automatically identifies mathematical chart patterns (like Ascending Triangles) with neckline trigger levels, targets, stop loss recommendations, and action signals.
Sideways Chop Zone Avoidance
Identifies the day of the week and active trading slot with the highest Sideways (🔵) probability. Use this data to sit on your hands, scale down sizing, or execute option writing/premium-decay strategies.
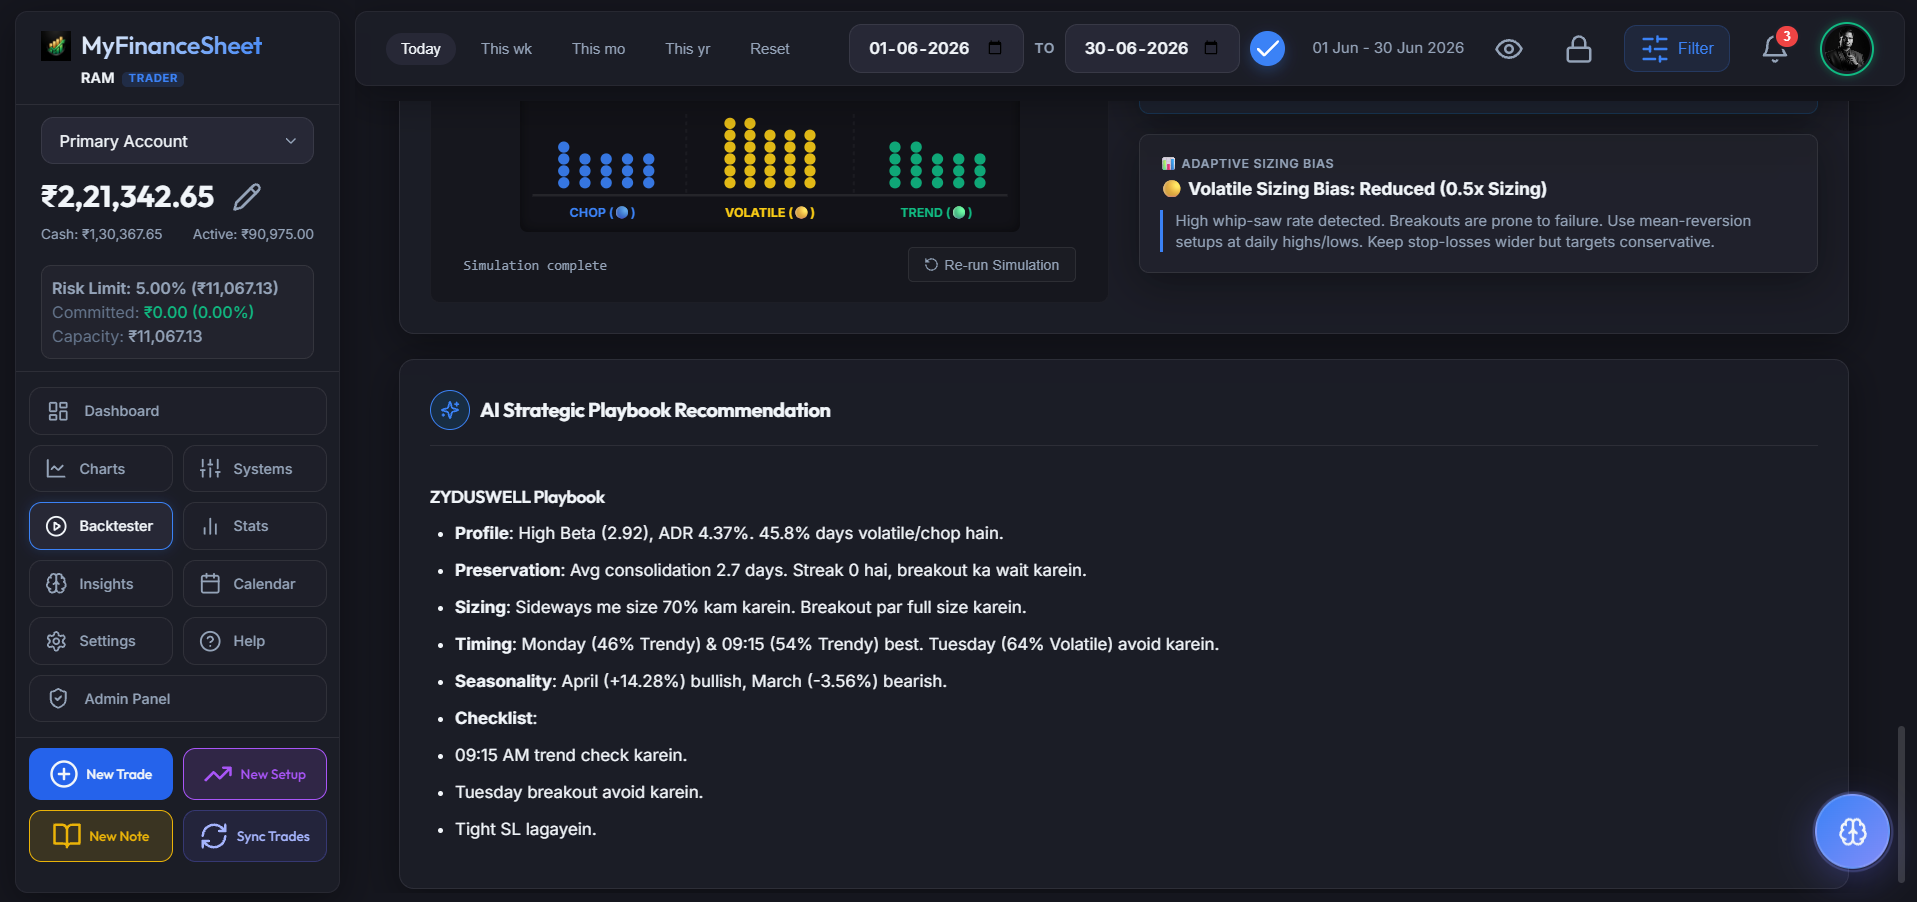
AI Strategic Recommendations
Generates automated strategic playbook recommendations based on the asset's active regime, including entry/exit checklists, timing alerts, and preservation guidelines.