Interactive Console
Performance Analytics
Filter and dissect your execution metrics like a quantitative fund. Uncover high-probability sweet spots and remove persistent psychological leaks.
Deep Analytics & Metrics Suite
Walk through the metrics of the MyFinanceSheet performance console and see how a mathematical edge is analyzed.
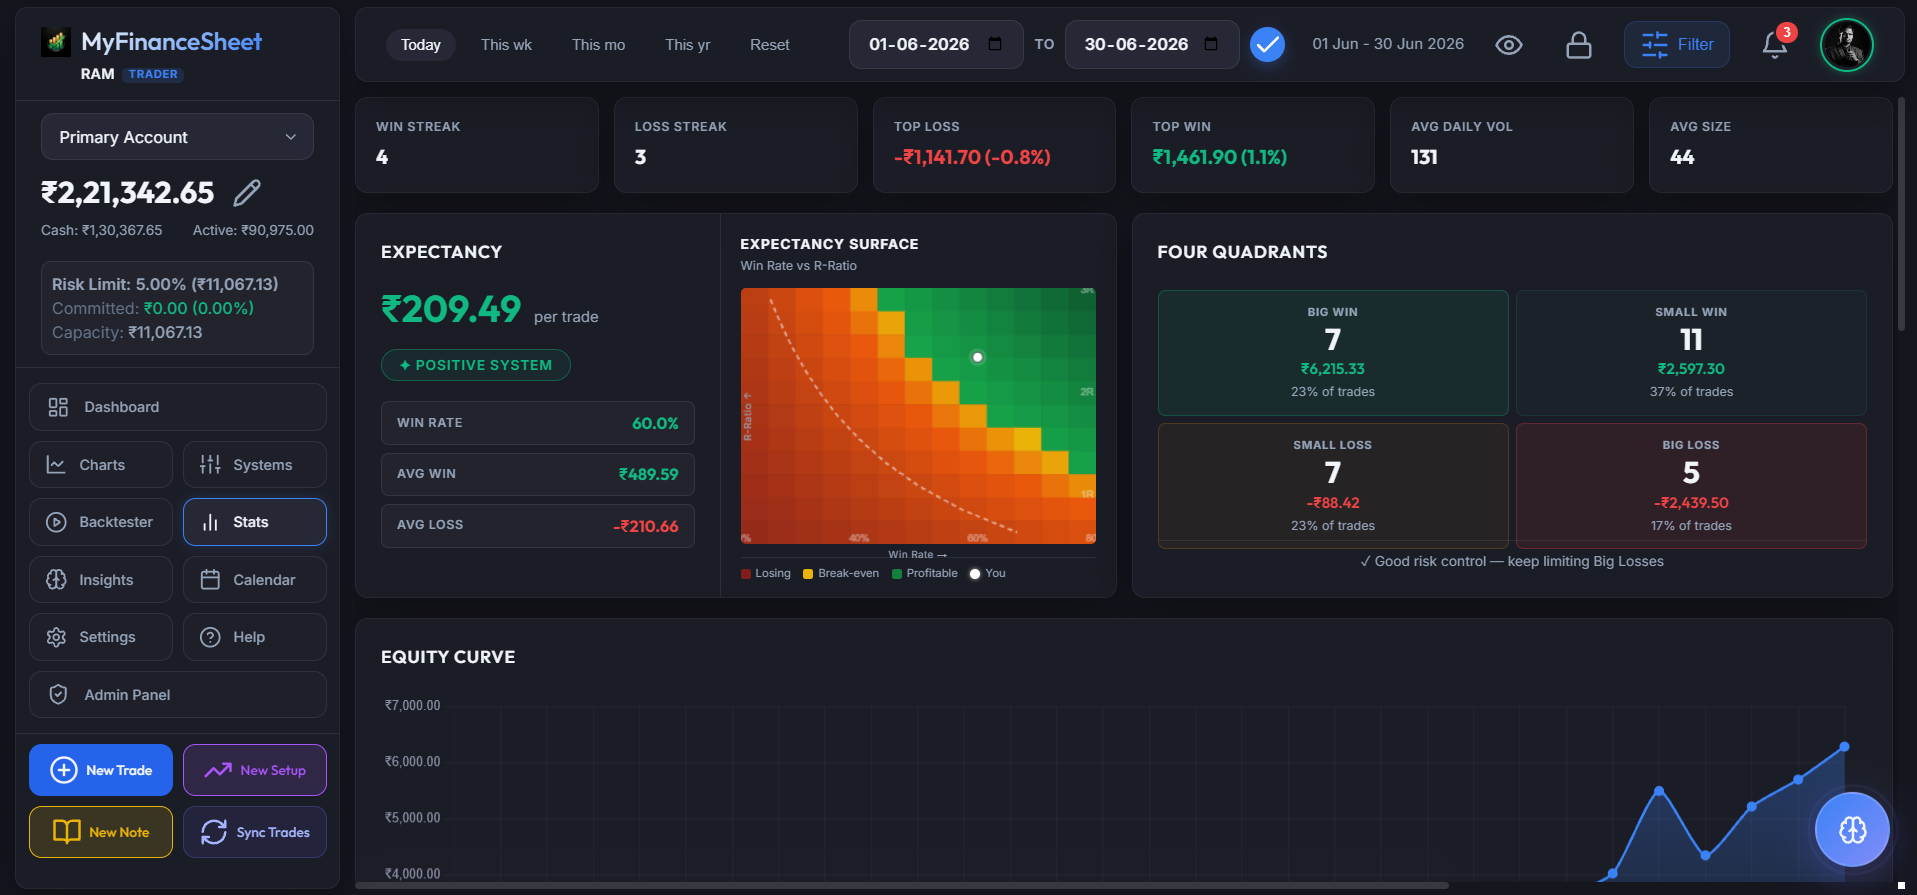
Executive Performance KPIs
Tracks cumulative Net Profit, Win Rate, Profit Factor, Expectancy, and Average Win/Loss ratios in real-time, giving you an institutional-grade breakdown of your trading edge.
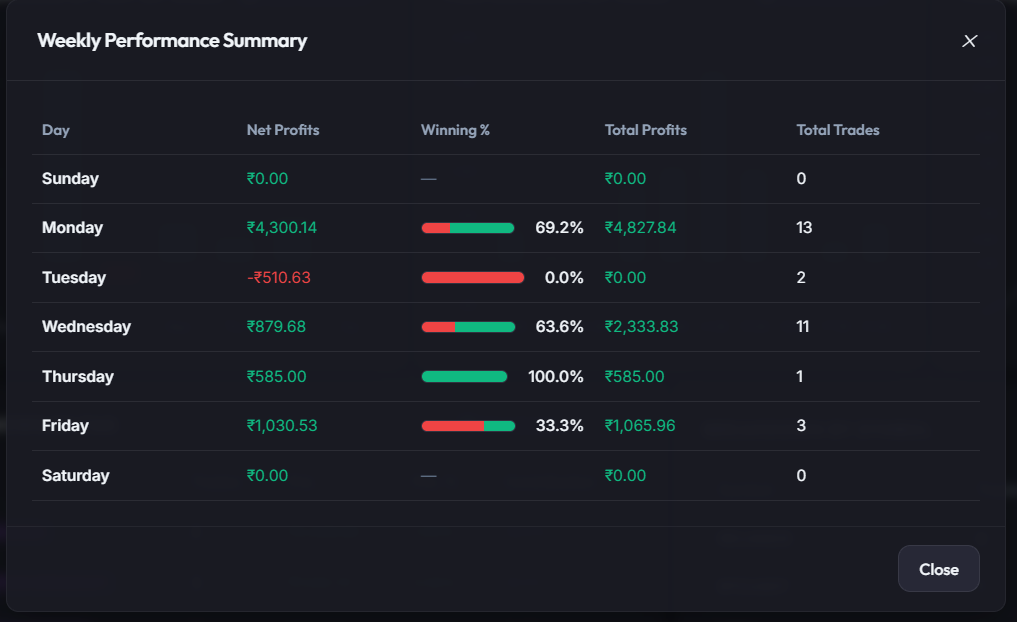
Weekday Expectancy
Plots performance metrics categorized by weekdays. Pinpoint if your Mondays carry a high fee overhead or if your Fridays are consistently your most disciplined trading sessions.
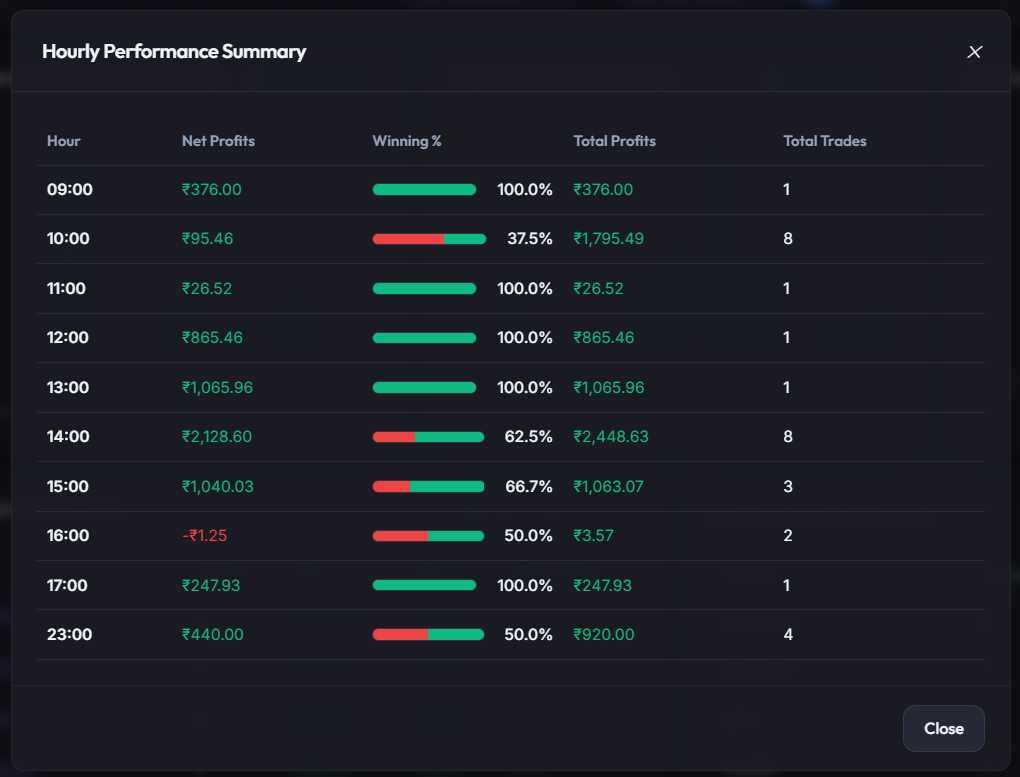
Intraday Hourly Heatmap
Dissects your executions by hourly intervals to flag sweet spots. Spot patterns like high early morning breakout momentum vs. late afternoon emotional exhaustion leakage.
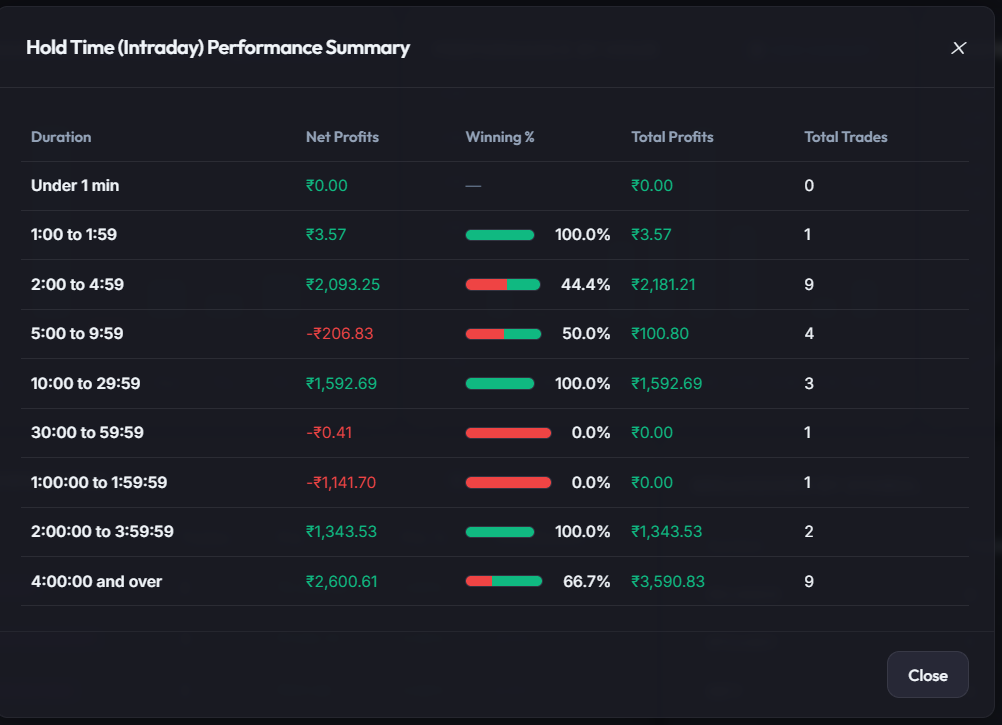
Holding Time Edge
Correlates trades by holding duration to check if cut-winners-early or hold-losers-too-long biases are destroying expectancy. Optimizes stop/target timing structures.
Expectancy Surface
An advanced 3D matrix visualization matching win sizes with win rates. Shows the target-risk adjustments required to sustain a positive mathematical expectancy.
Emotional Tag Leakage
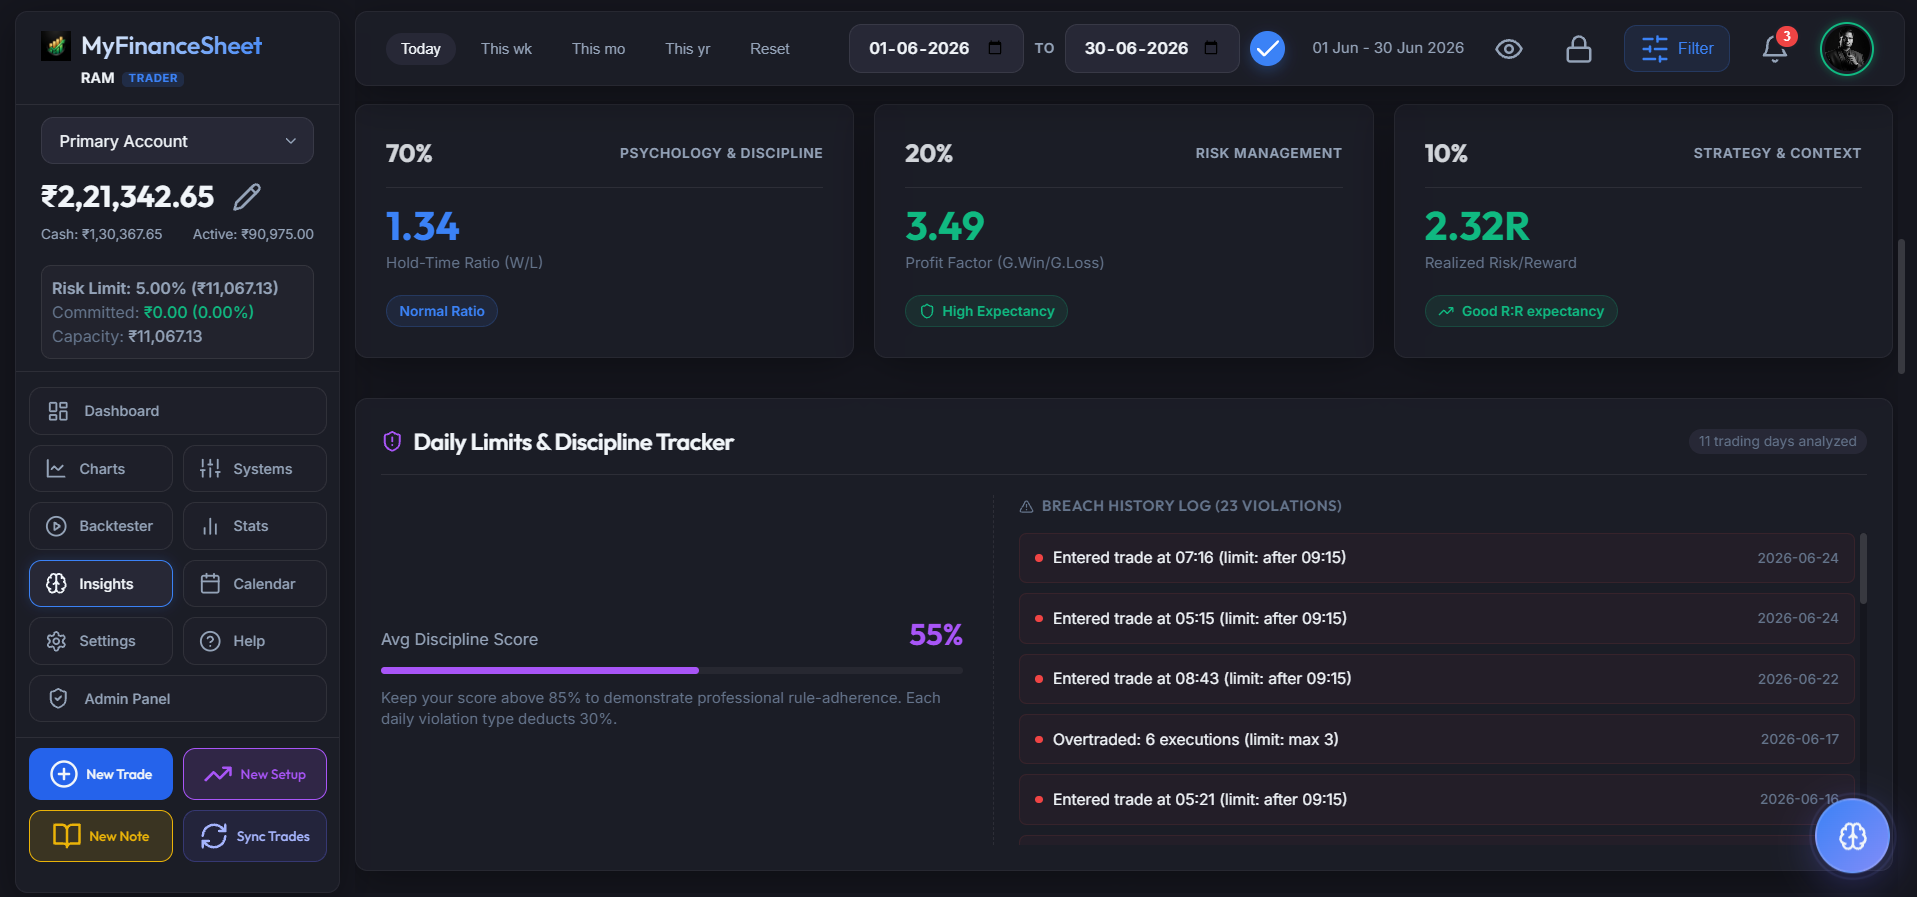
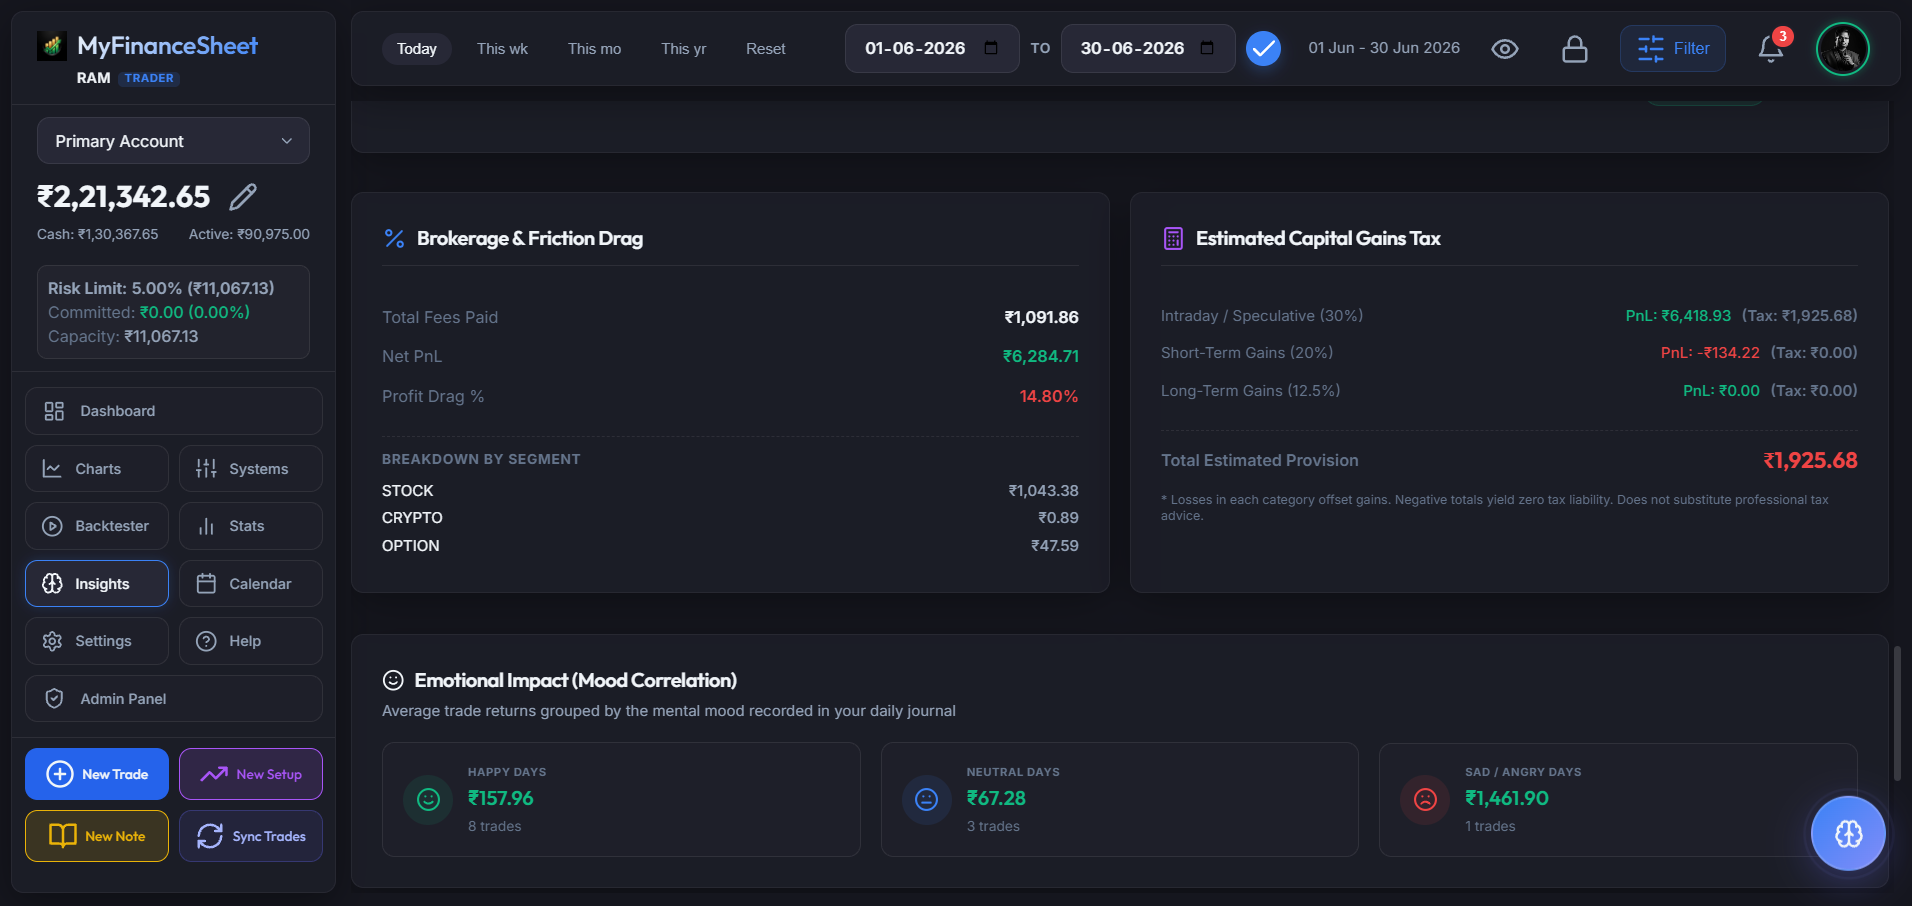
Tracks custom tags (e.g. FOMO, Over-leveraging, Revenge Trading) to identify which psychological behaviors cause the most capital decay. Translates mistakes into concrete financial costs.
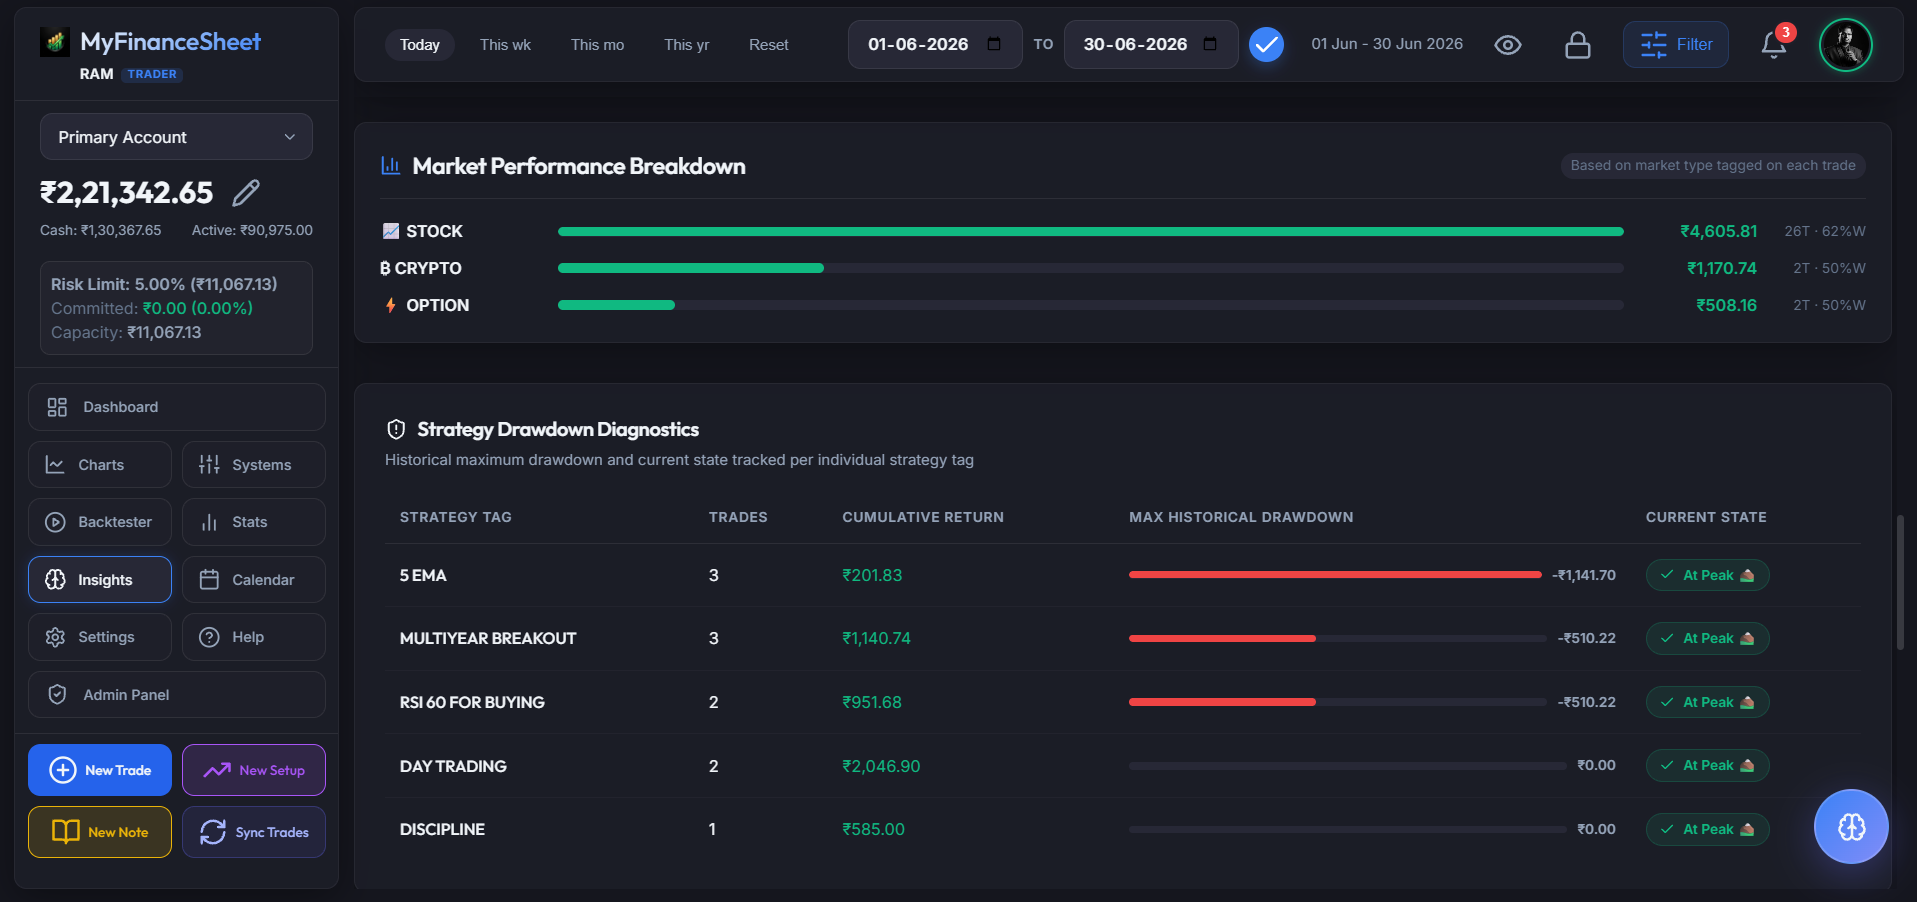
System-Wise Metrics
Compares win rates, win-loss streaks, and net returns across different setups and strategy systems. Keep what works and cut low-expectancy patterns.