Historical Setup
Strategy Backtester
Stop trading on gut feelings. Define rules-based entry, exit, and risk-management configurations to test your trading systems against historical market data.
Systematic Validation
Successful systems are built on math, not luck. The Strategy Backtester allows you to analyze historical daily setups and generate detailed reports outlining performance stats.
Instantly evaluate key metrics like Win Rate, Profit Factor, Max Drawdown, and mathematical expectancy. Optimize entry conditions and risk-to-reward targets before risking real capital.
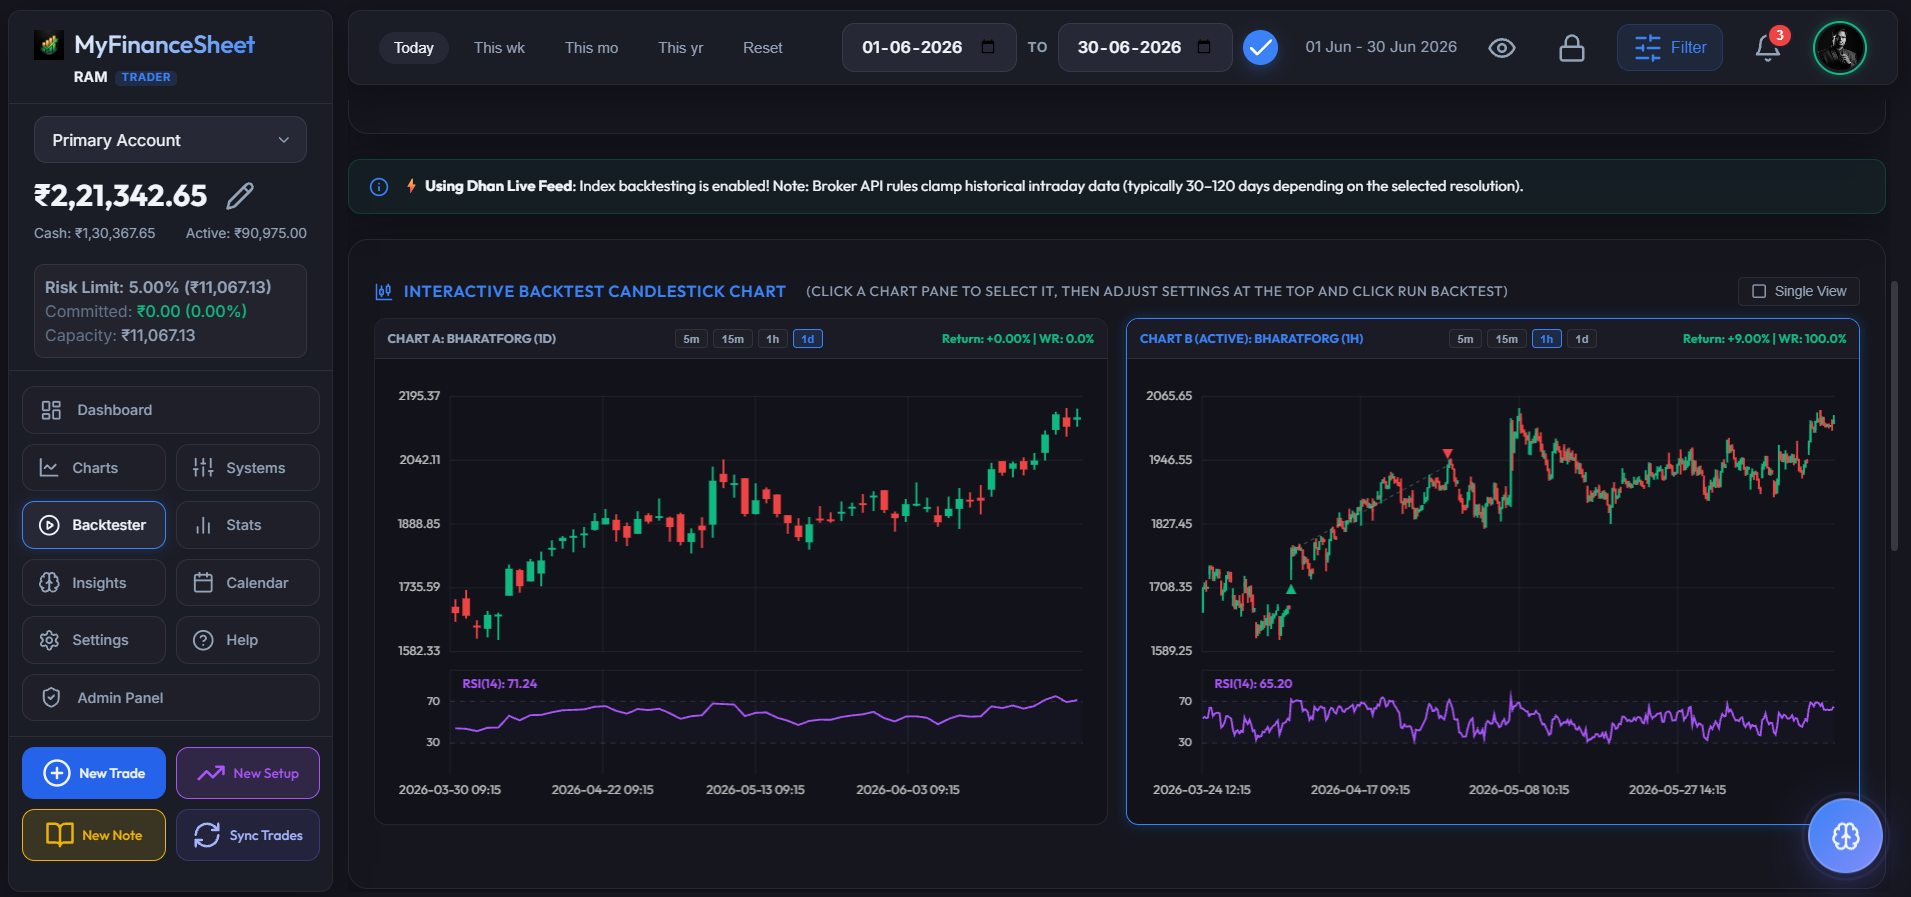
Backtest Engine Sandbox
Live simulation of rules-based entry/exit signals.
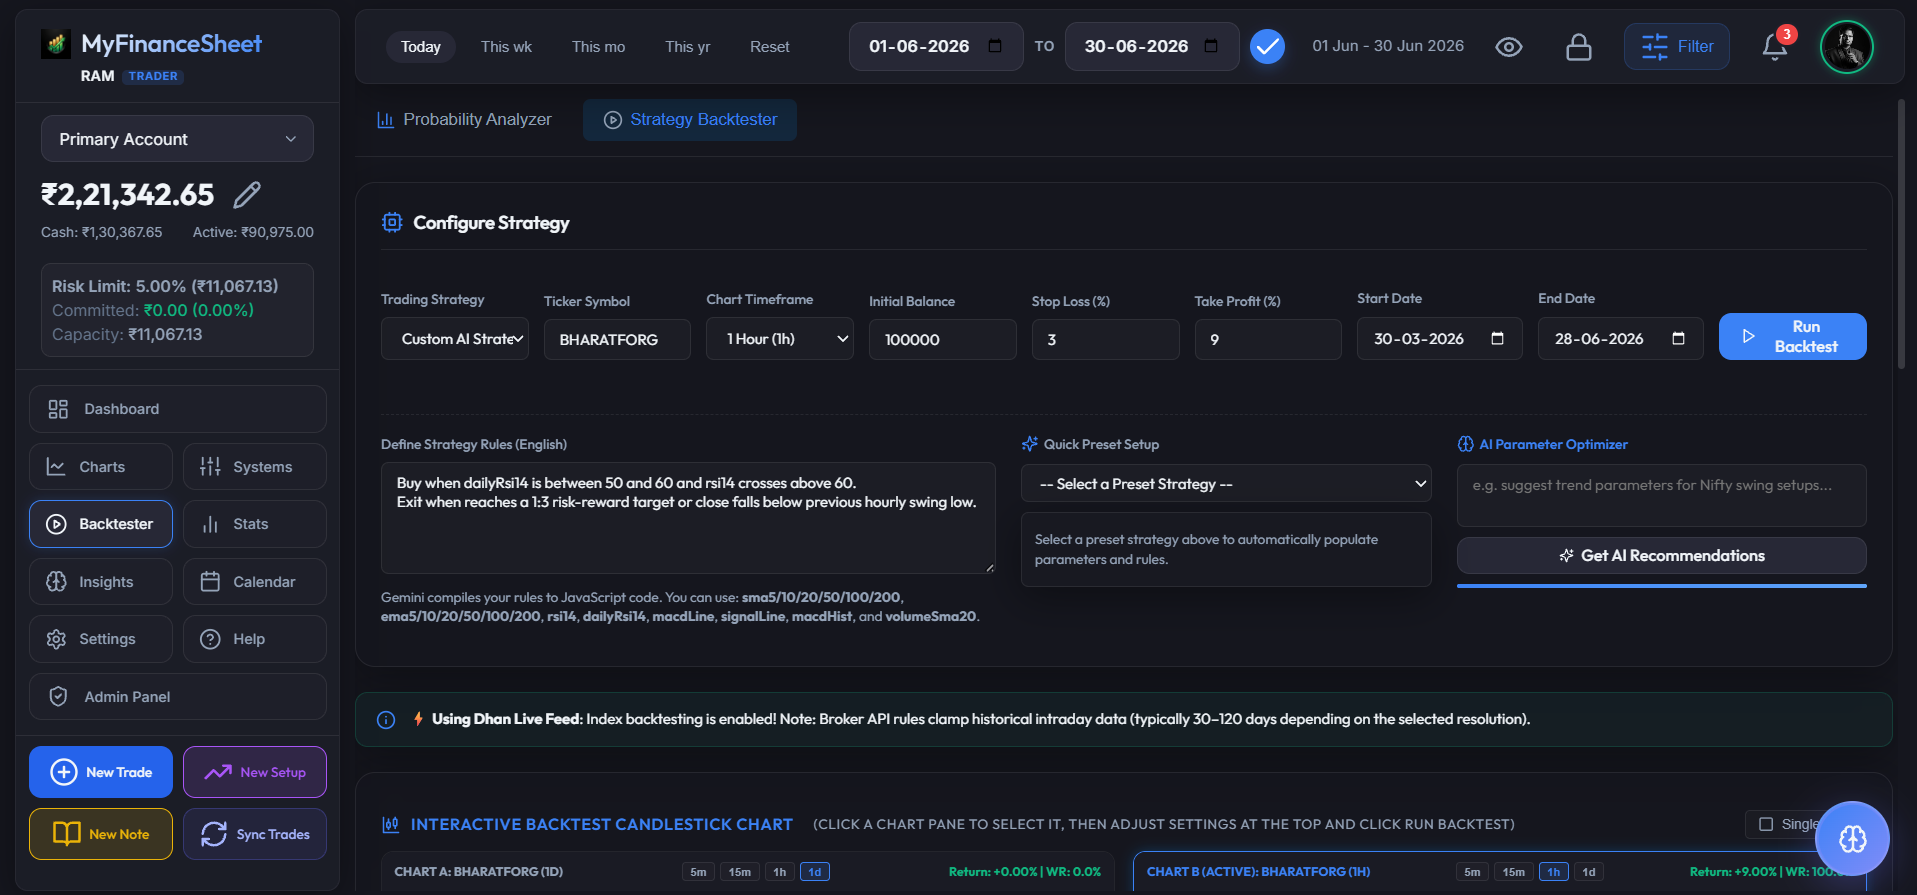
Define Strategy Rules & Ranges
Input your trade logic parameters including lookback periods, ticker targets, entry/exit thresholds, and custom risk definitions. Set your initial deposit and sizing configuration rules to run localized backtests.
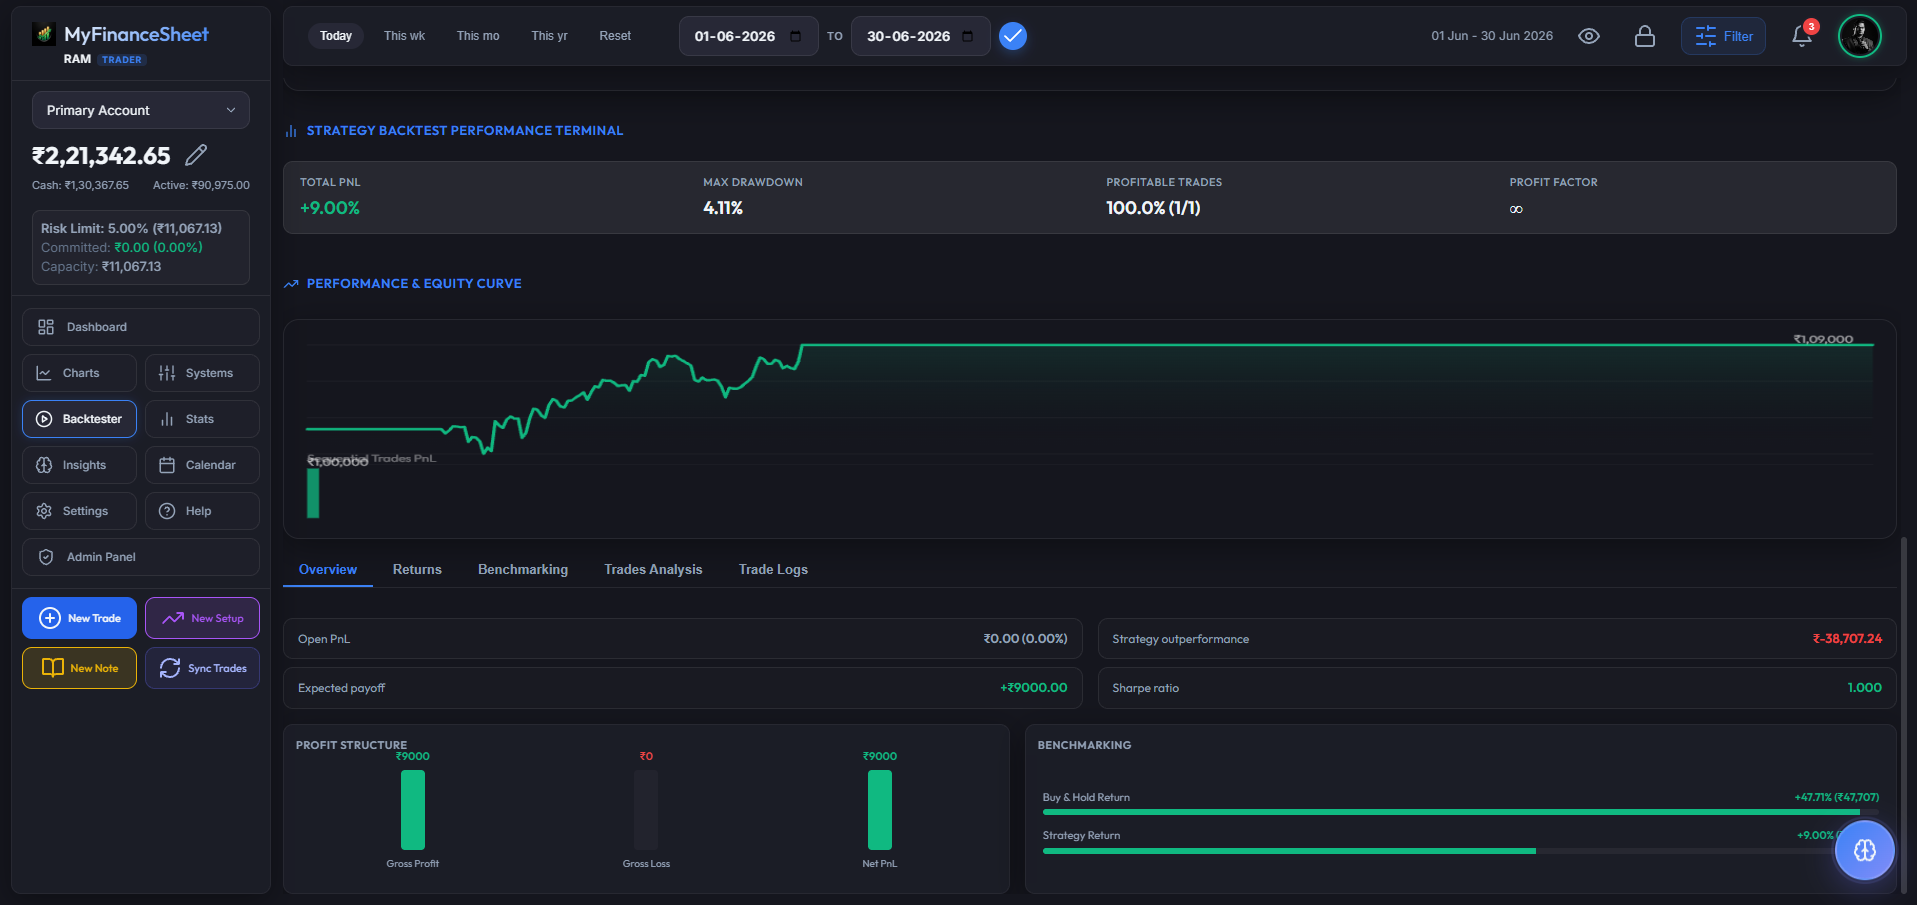
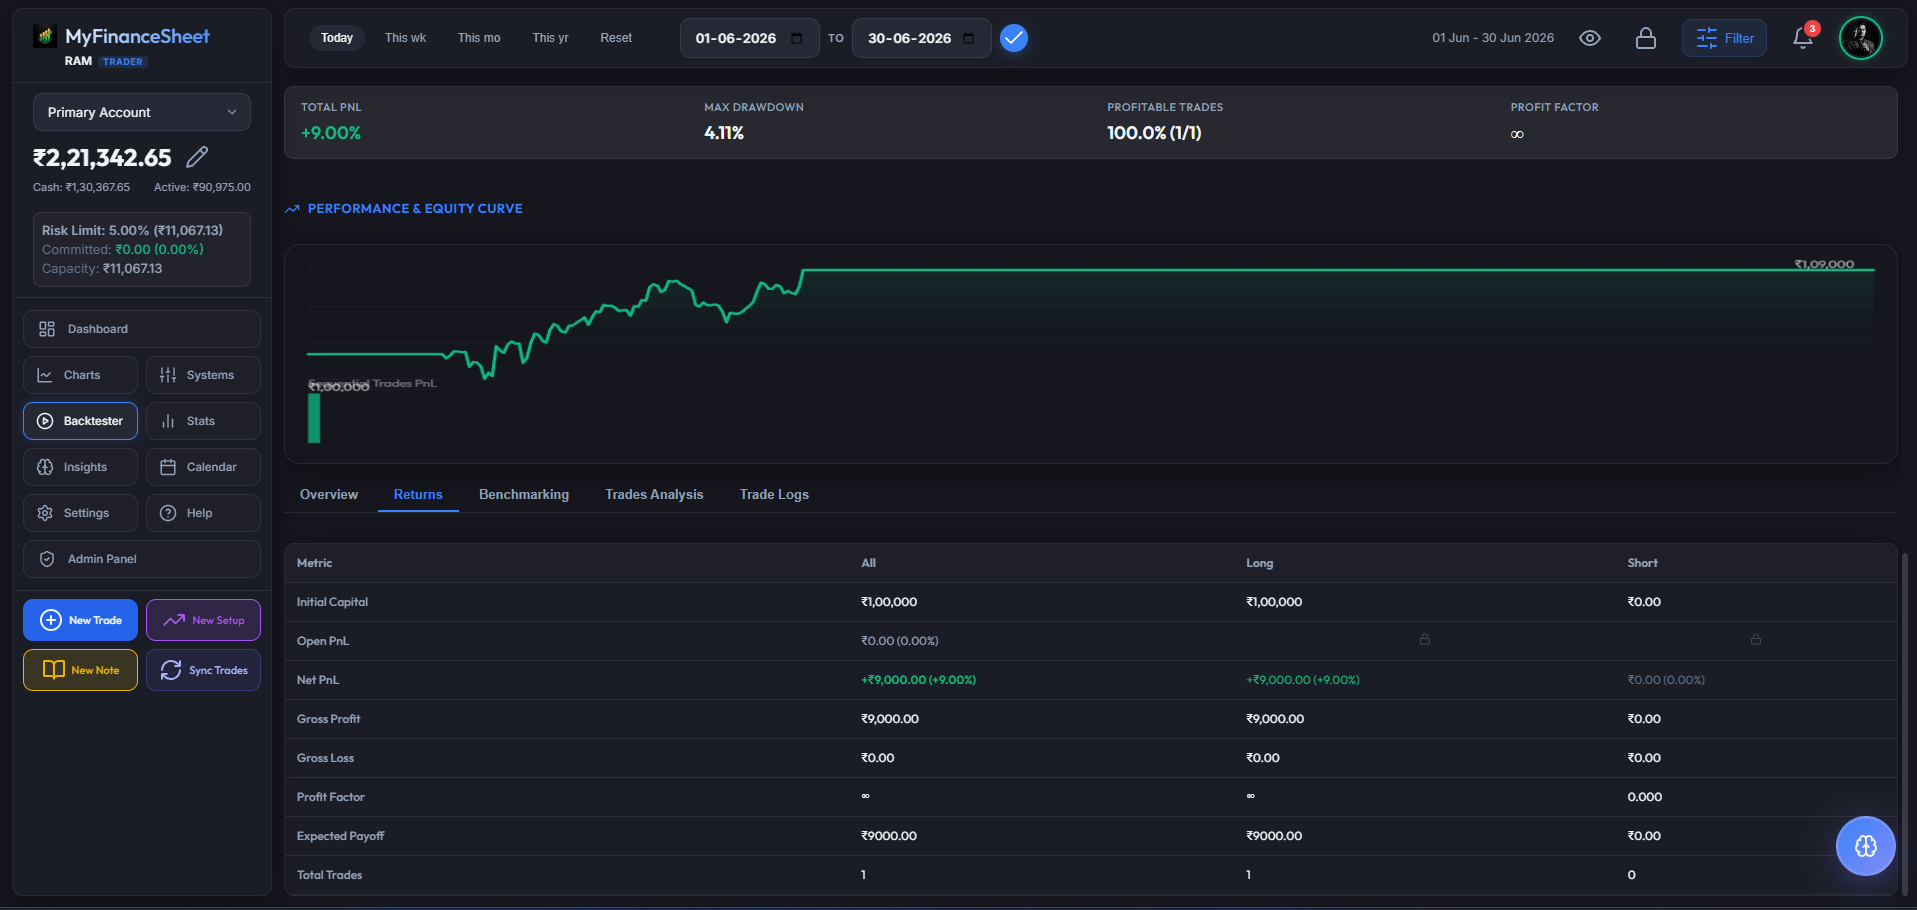
Aggregated Backtest Reports
Once compiled, view detailed reports outlining absolute metrics like total return percentage, max drawdown depth, expectancy score, profit factor ratio, and consecutive win/loss statistics to identify system edge.
Granular Execution Tables
Inspect the tabular logs containing precise details for every trade buy and sell signal, entry/exit datetime, trade duration, price parameters, slippages, net returns, and visual indicator values.
Visual Drawdown & Equity Curves
Study the graphical equity curve to visualize compounding growth and see period drawdowns overlaid against benchmark indices, allowing you to gauge performance under different volatility regimes.