Multi-Account
Data-Driven Performance Analytics
Multi-Account
Data-Driven Performance Analytics
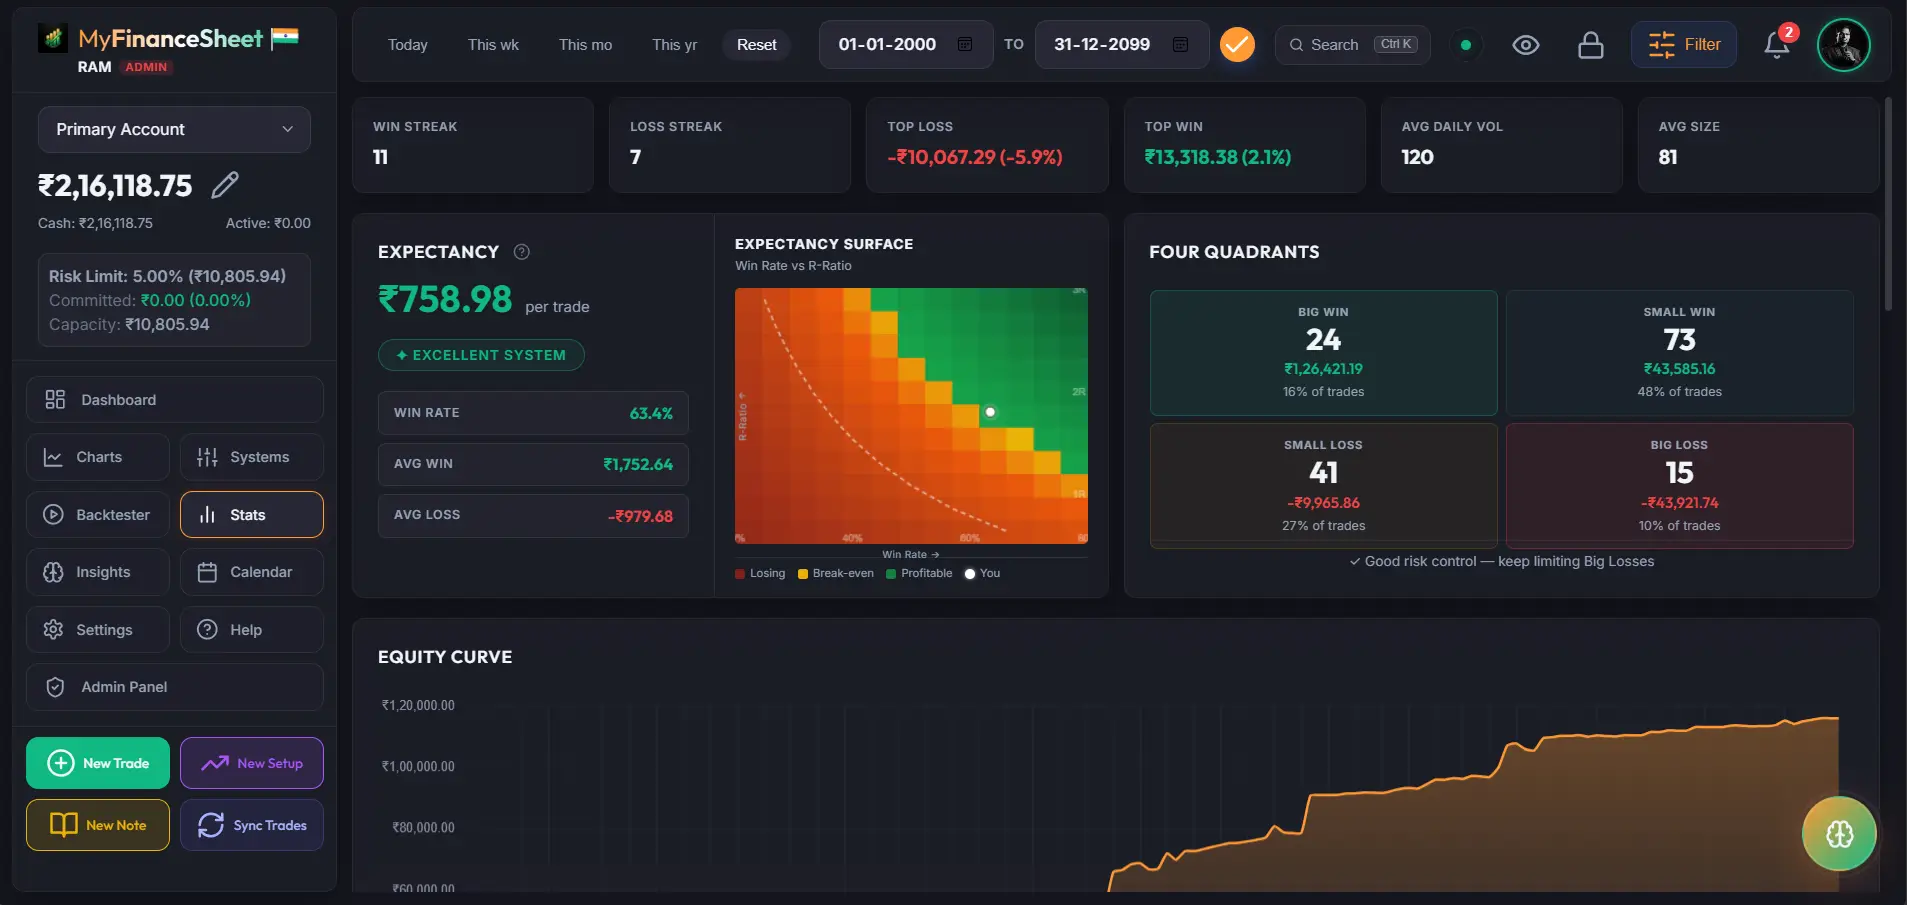
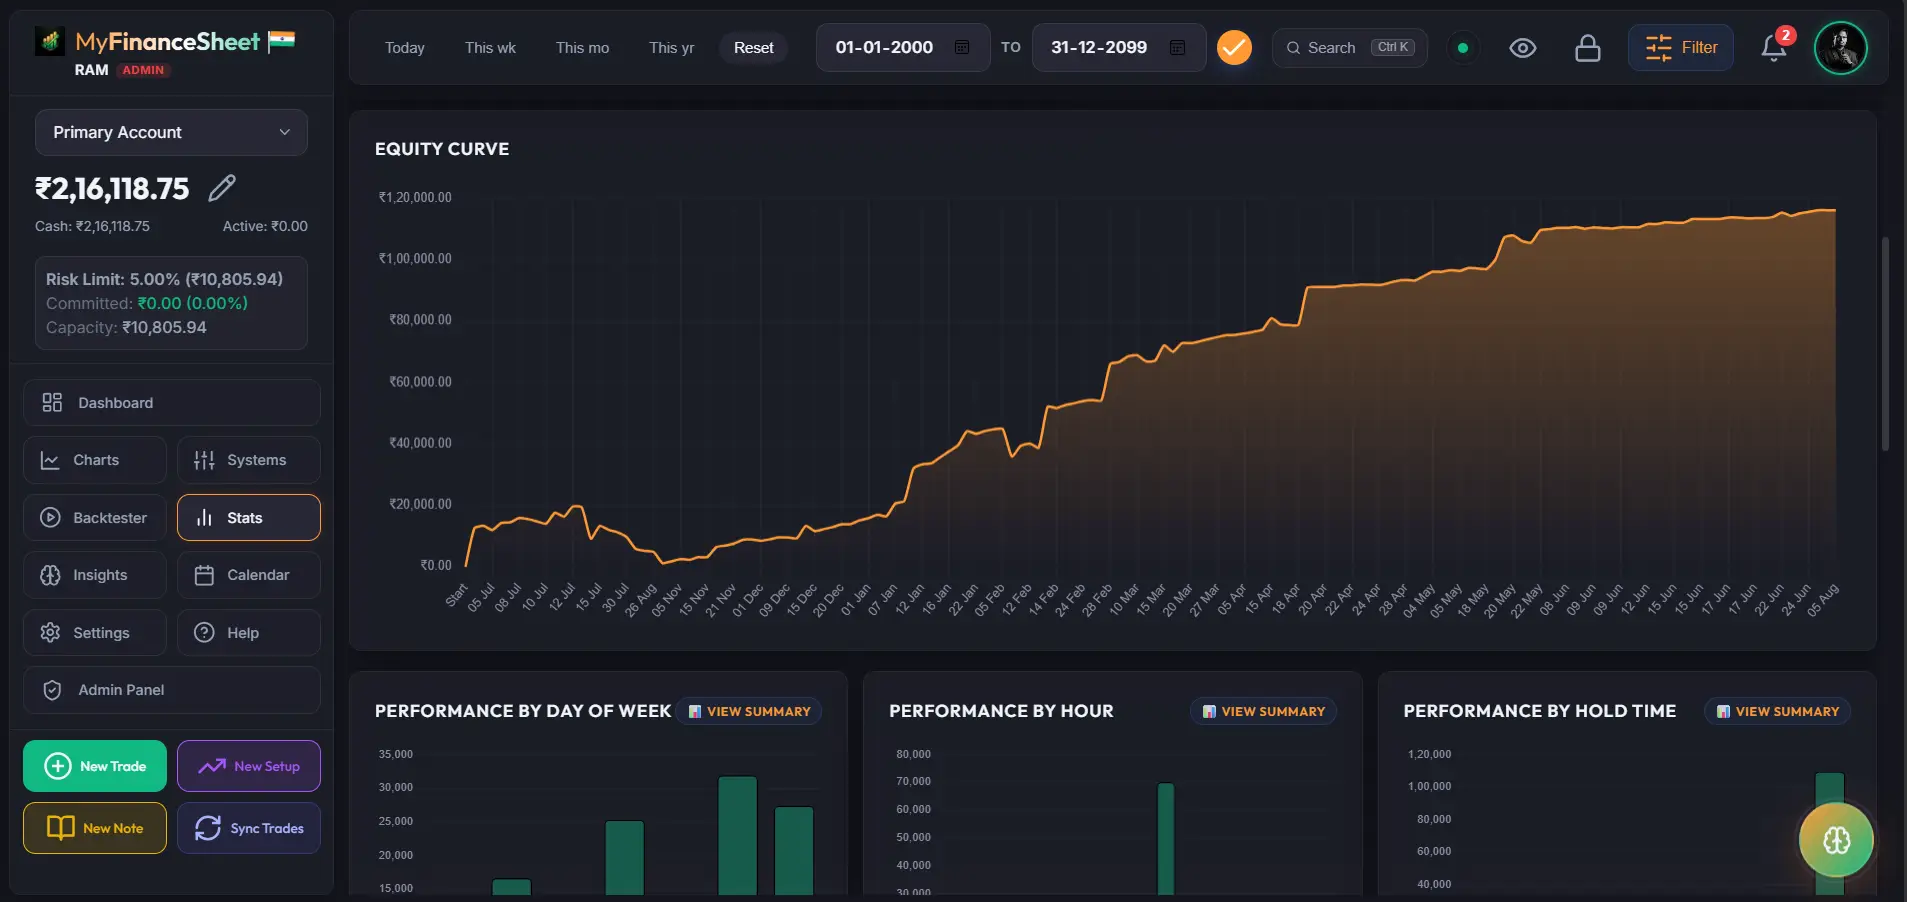
Ditch spreadsheets. Seamlessly track single or multi-broker accounts in one consolidated dashboard with visual analytics built to help traders locate their edge and optimize risk. Spreadsheets ko chhodein. Single ya multi-broker accounts ko ek consolidated dashboard me track karein, aur visual analytics se apna edge locate karke risk optimize karein.
Visual Trade Analytics & Edge TrackersVisual Trade Analytics & Edge Trackers
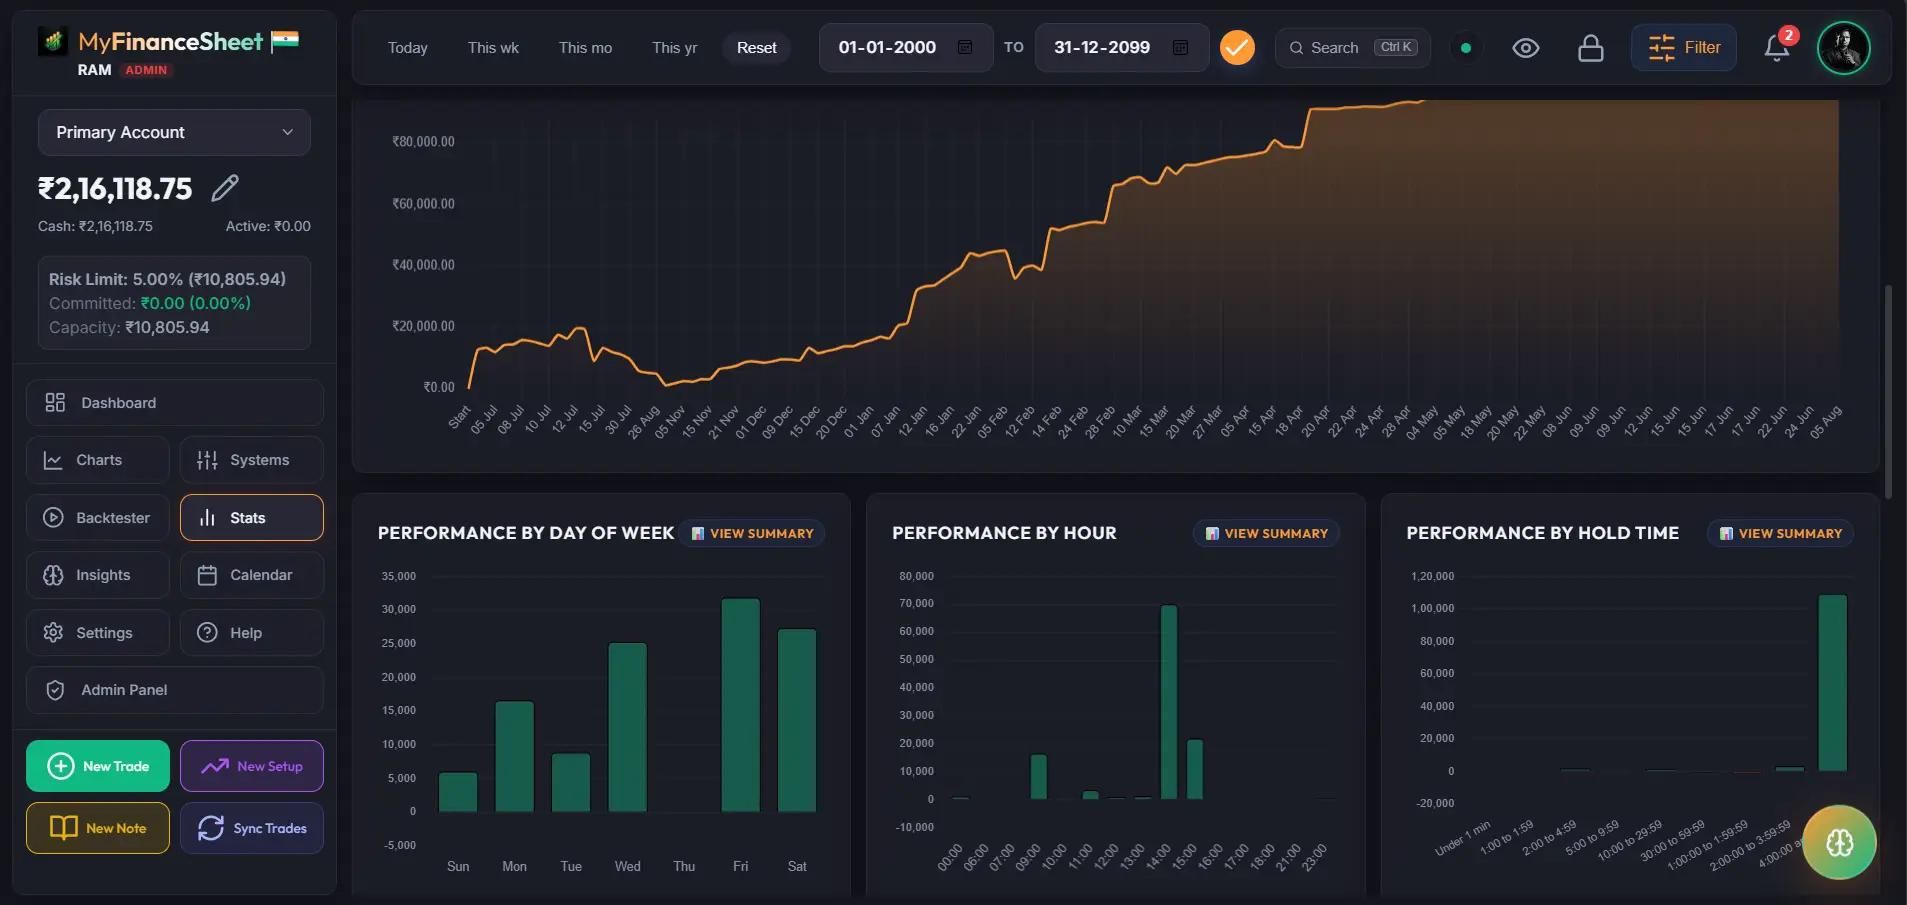
Evaluate your mathematical edge instantly. Track performance distributions across days, hours, and holding times, while examining tag and symbol breakdowns to identify where your setups excel. Apne mathematical edge ko instantly evaluate karein. Days, hours aur holding times ke across performance distribution ko track karein, aur setups aur symbols ka analyze karke profit zones ko pinpoint karein.
- Day-of-week & Hourly win percentage analysisDay-of-week aur Hourly win percentage analysis
- Breakdown by mindset tags and setupsMindset tags aur setups ke according detailed breakdown
- Asset-wise net returns and symbol performanceAsset-wise net returns aur symbol-wise performance stats
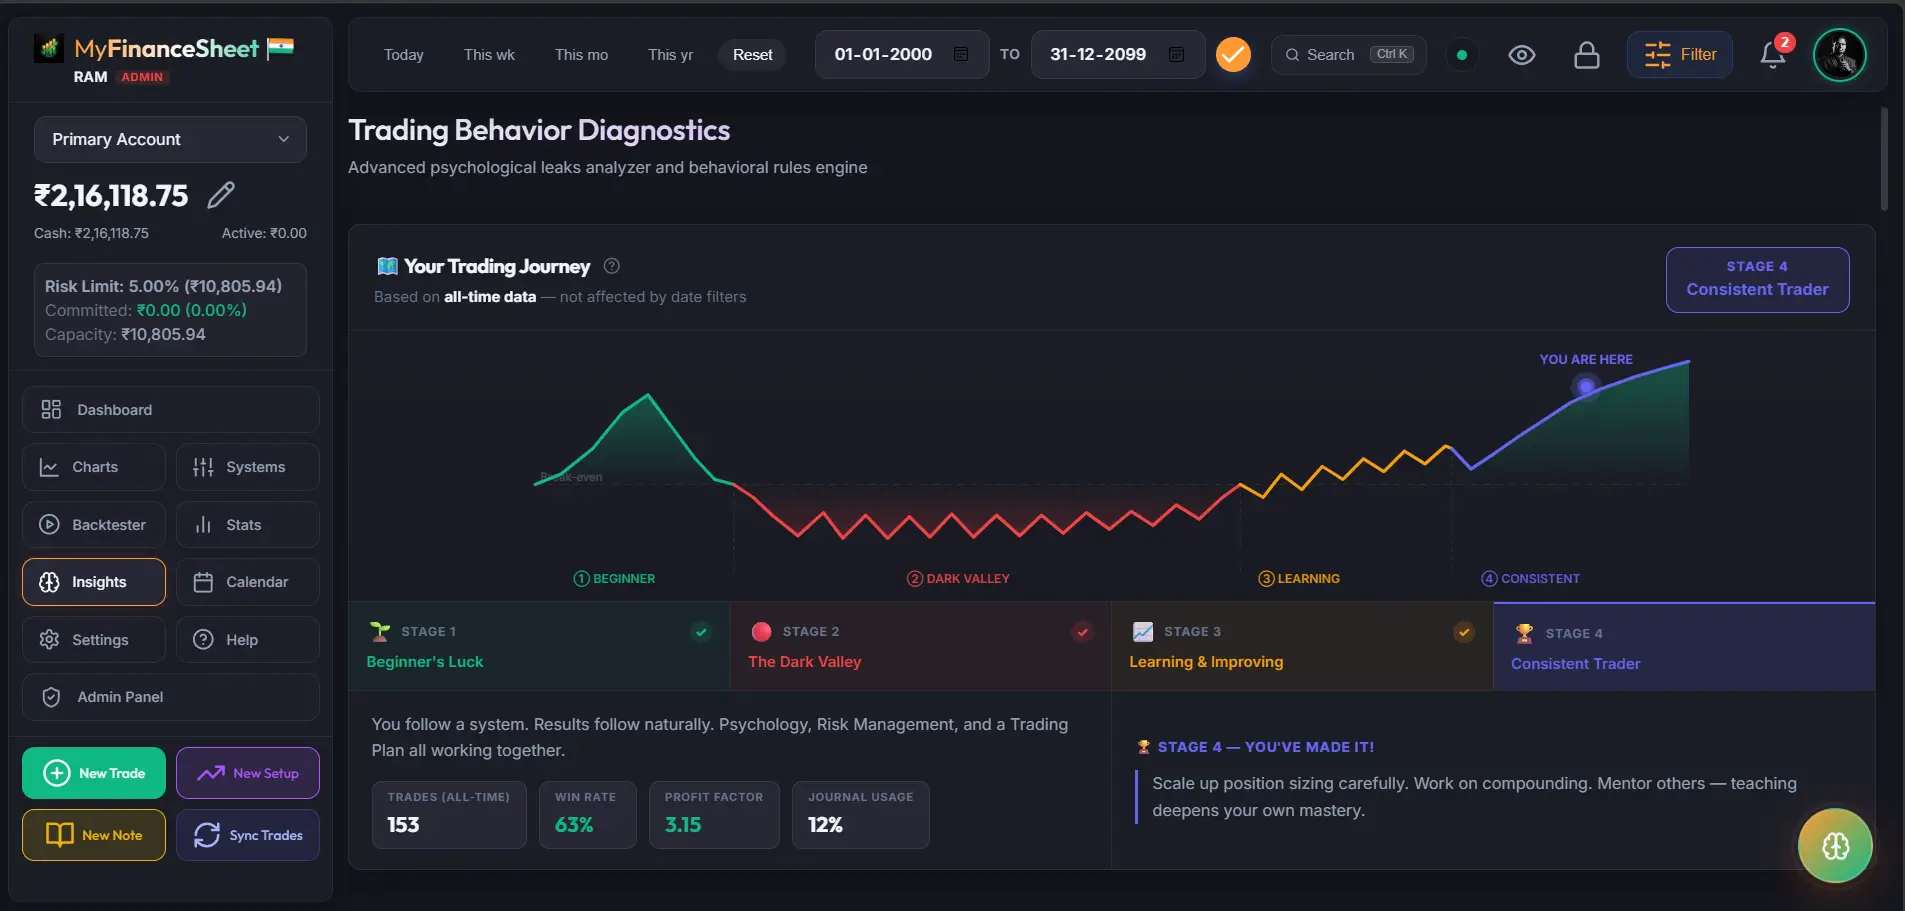
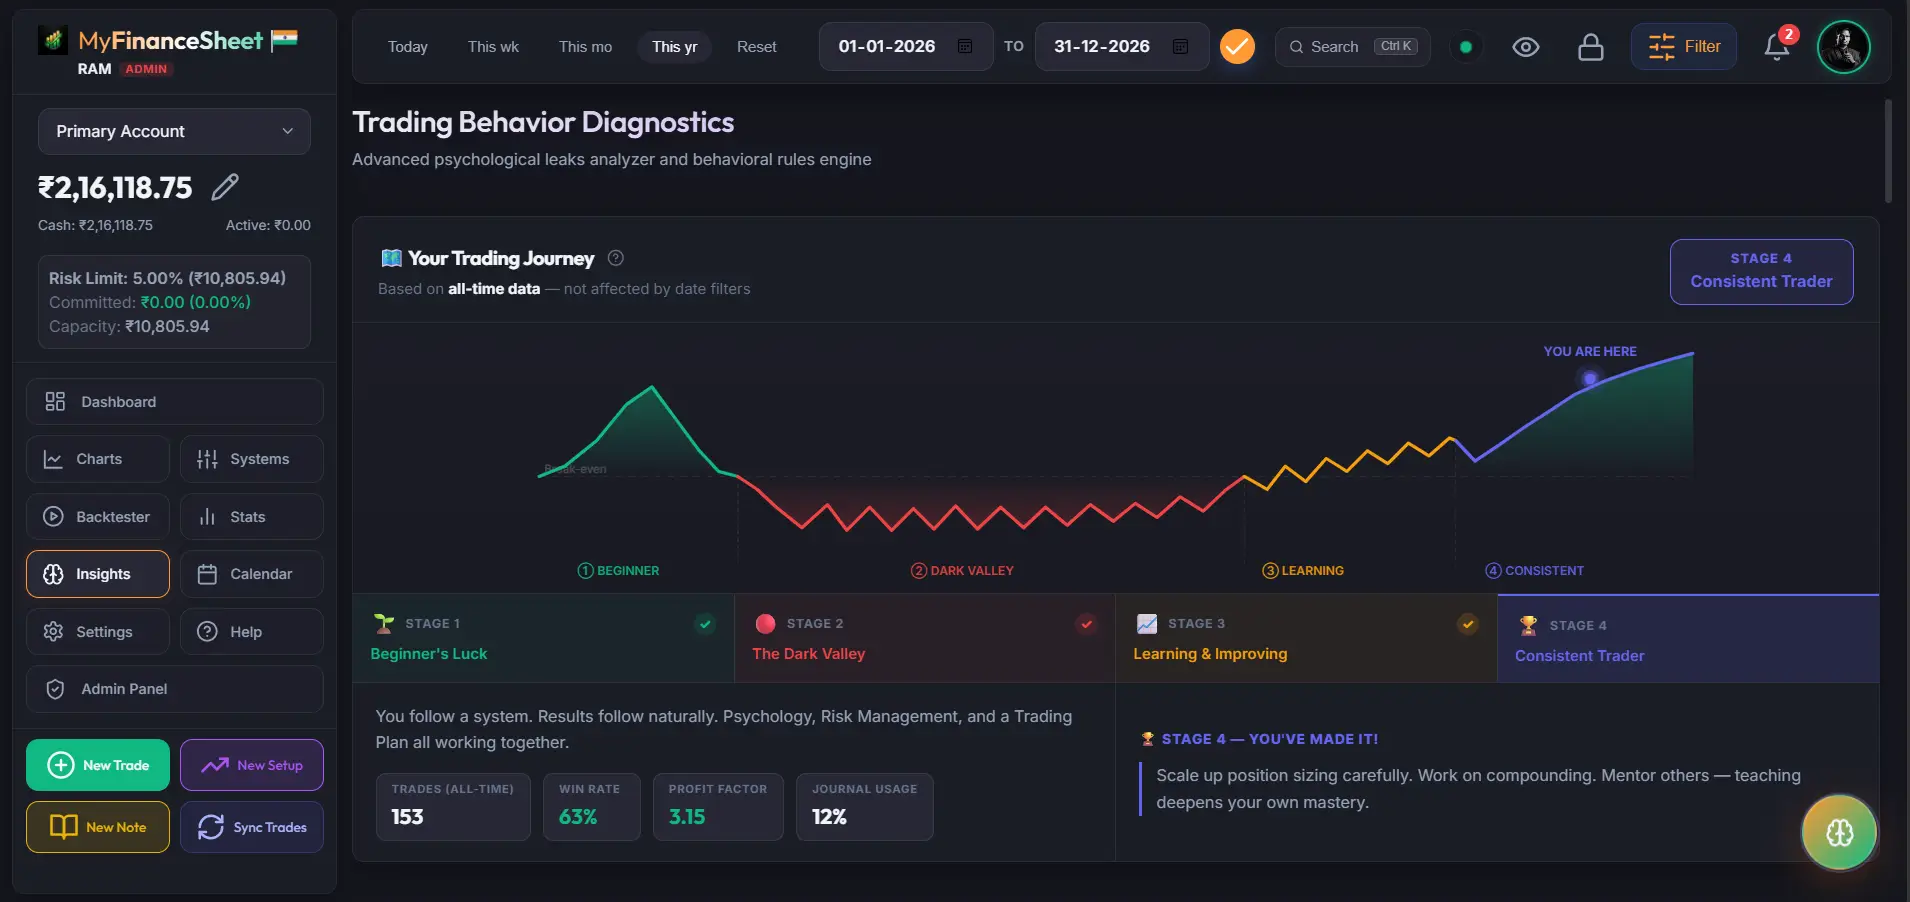
Your Trading Journey & Leaks AnalyzerYour Trading Journey & Leaks Analyzer
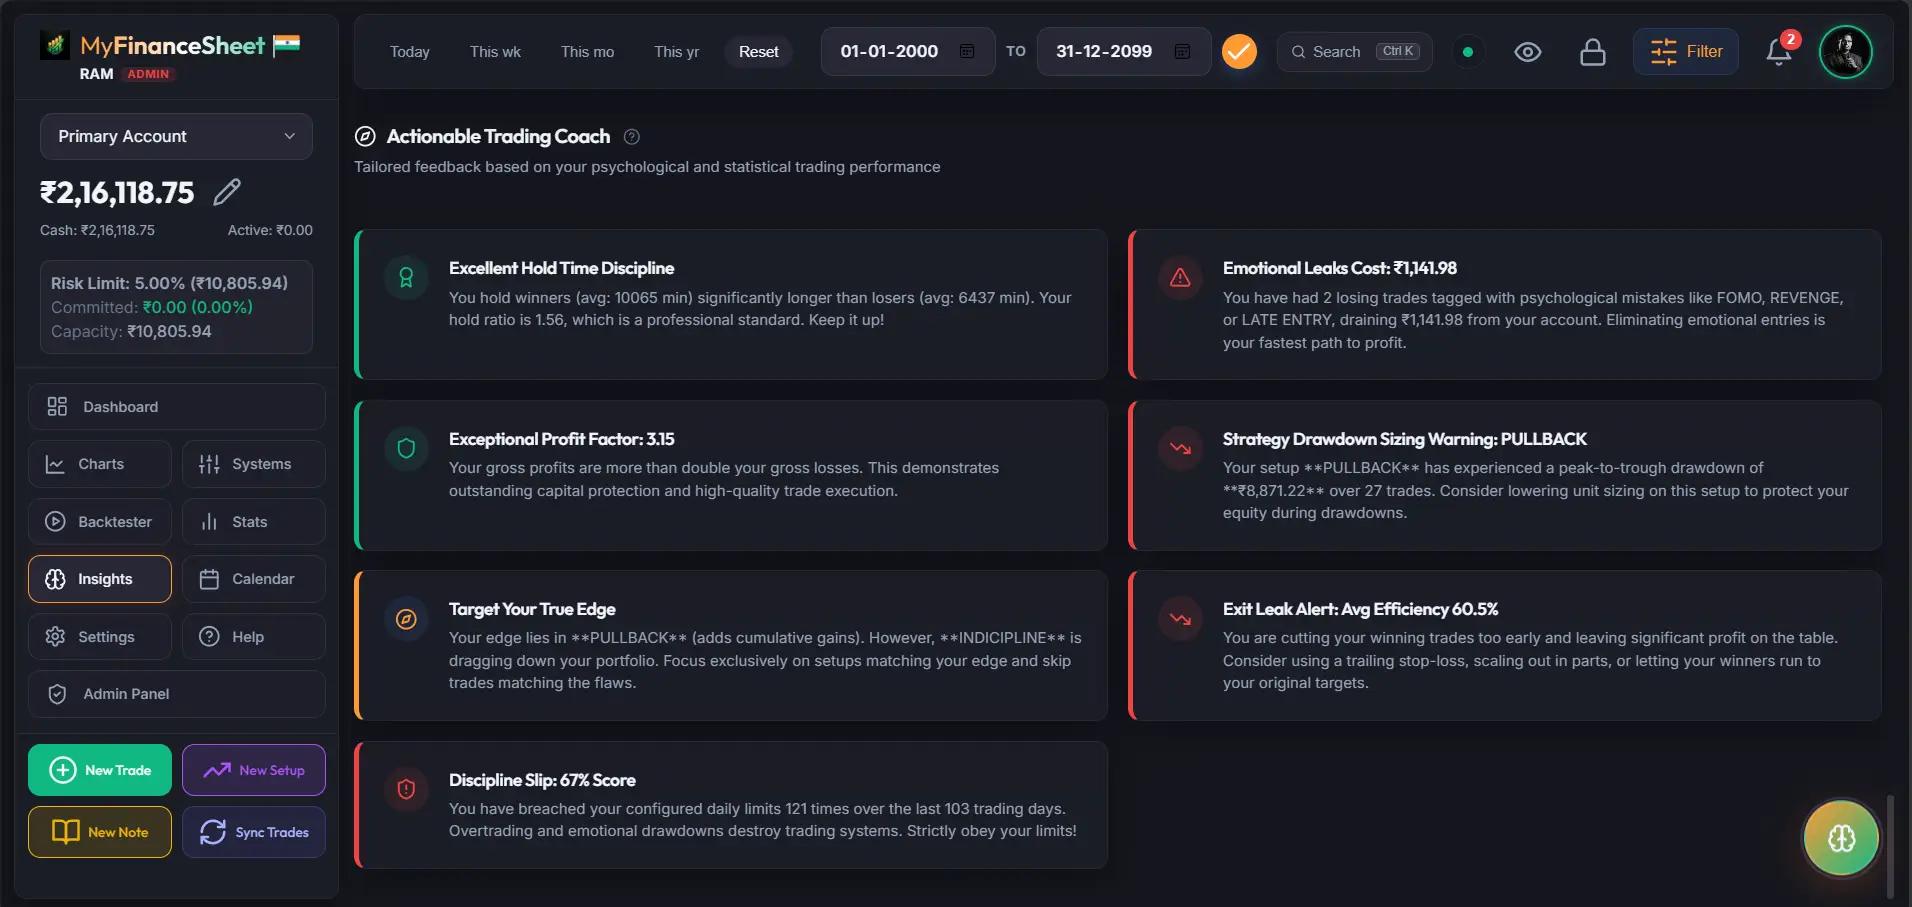
Analyze your psychological evolution. Track your trading consistency across four dynamic stages: Beginner's Luck, The Dark Valley, Learning & Improving, and the Consistent Trader phase. Apne psychological development ko analyze karein. Apni trading consistency ko 4 dynamic stages me track karein: Beginner's Luck, The Dark Valley, Learning & Improving, aur Consistent Trader phase.
- Stage-based progress trackingStage-based progress aur step-by-step consistency tracking
- Automated rules infraction warningsAutomated rules breakdown warnings aur alerts
- Behavioral feedback triggers linked to ROI curvesBehavioral feedback loops jo aapke ROI curves se linked hain
Profitability by Holding DurationProfitability by Holding Duration
Analyze trade holding times to detect over-trading or premature exits. Directly compare winning trade durations against losing ones to find your trade holding sweet spot. Over-holding aur premature exits ko detect karne ke liye trade holding times ko analyze karein. Wins aur losses ke durations ko compare karke holding sweet spot khojein.
- Hold time metrics mapped against net returnsNet returns ke sath hold time metrics ka graphical mapping
- Average hold time trackers for scalp vs swing setupsScalp vs Swing setups ke liye average hold time trackers
- Clear indicators for holding-loss patternsLoss patterns aur overholding patterns ke clear indicators
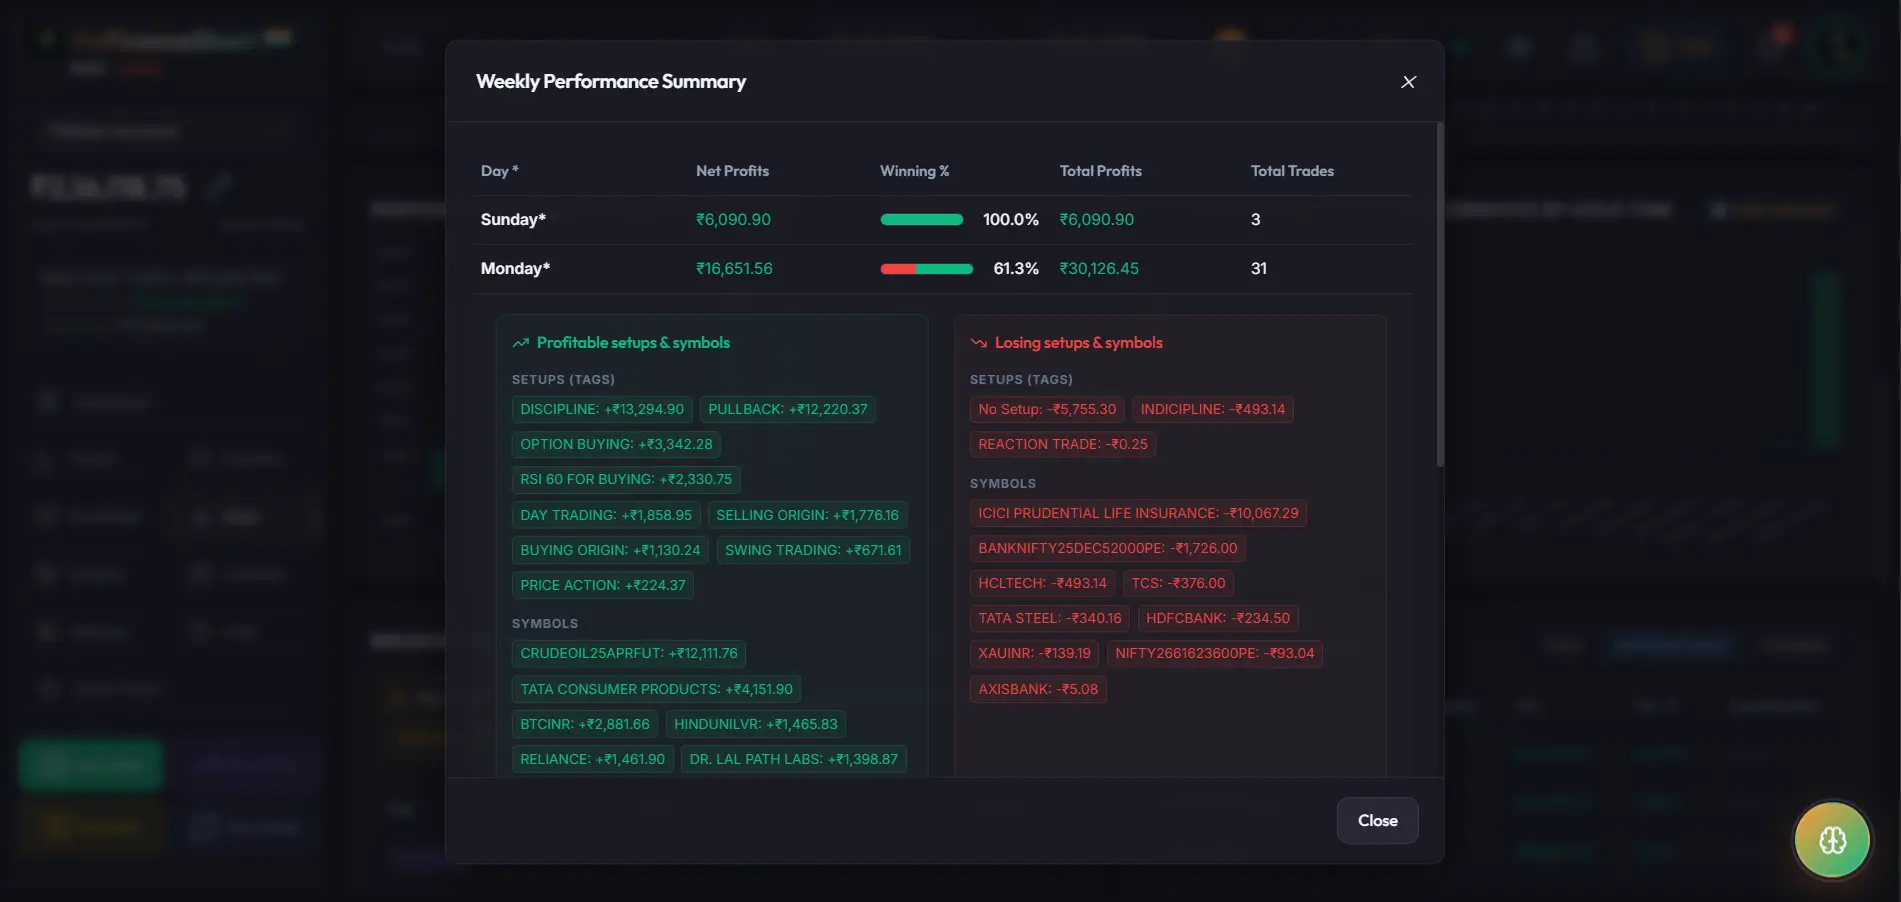
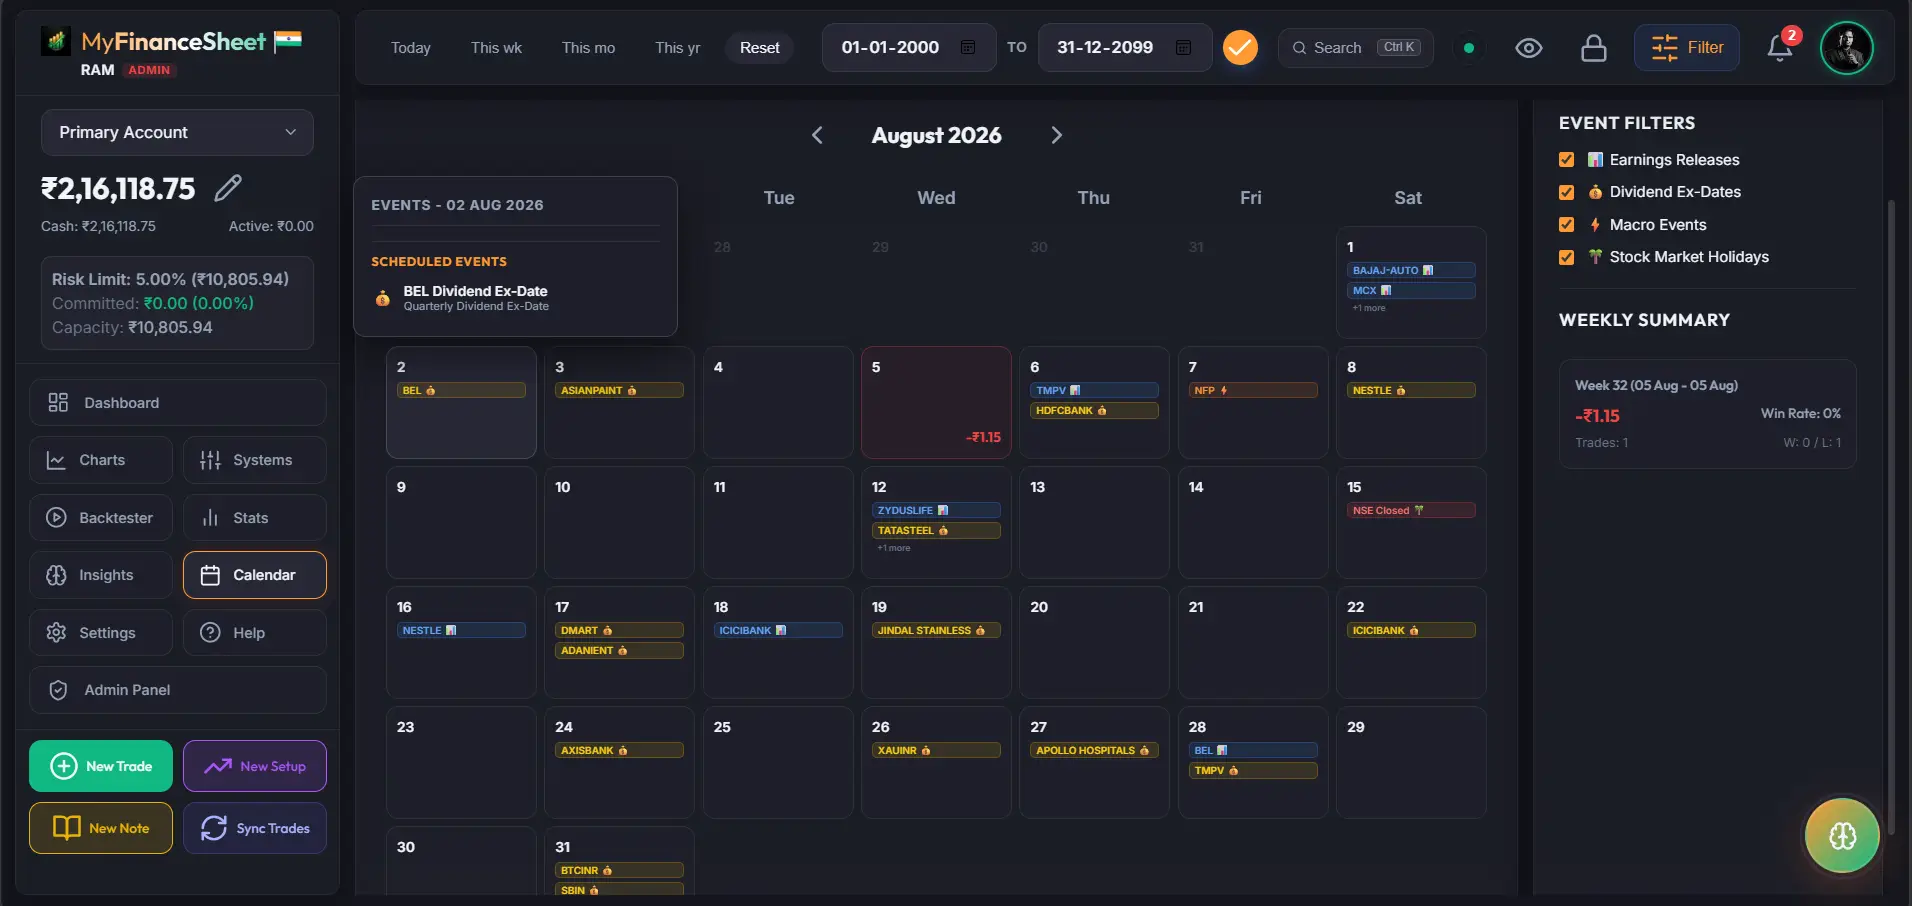
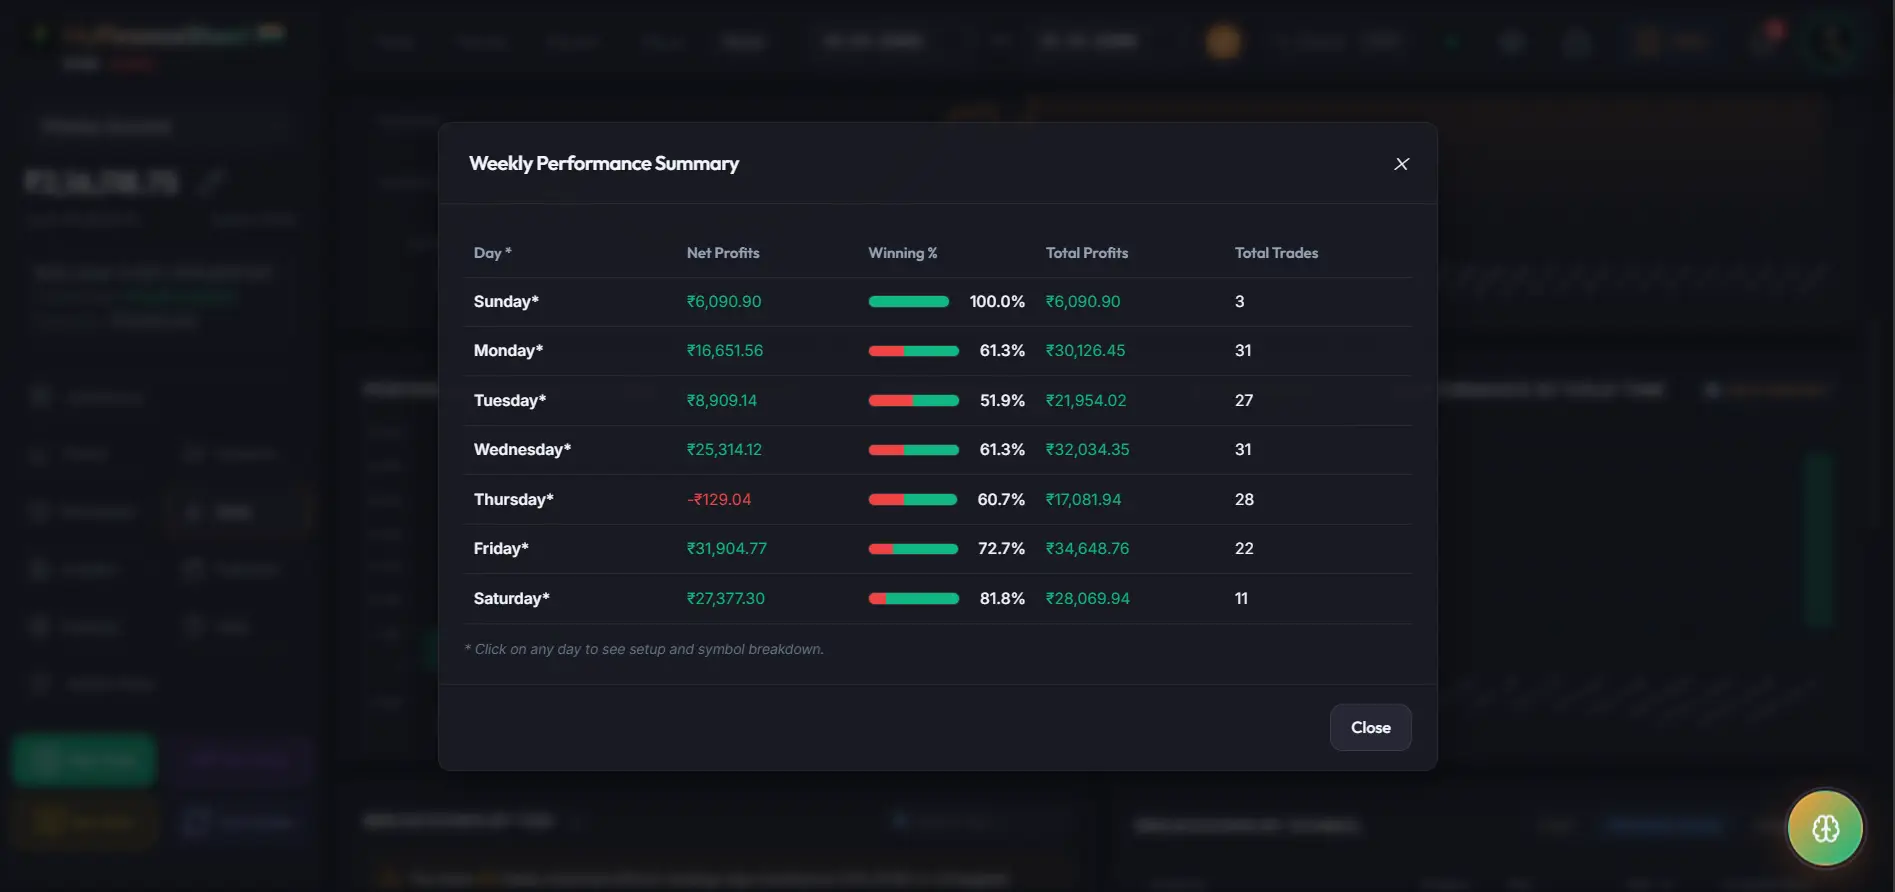
Weekly Performance SummaryWeekly Performance Summary
Analyze weekly execution setups and symbol performance. Identify which trading days produce the highest accuracy and isolate session patterns to maximize returns. Weekly execution setups aur symbol performance ko analyze karein. Pata lagayein ki kis day accuracy highest rehti hai aur session patterns ko isolate karein.
- Weekly setup performance accuracyWeekly setup ki performance accuracy aur metrics
- Breakdown of profitable vs losing symbols by dayProfitable vs losing symbols ka din ke hisab se detailed breakdown
- Optimized calendar-slot recommendationsAI-driven optimized calendar-slot recommendations
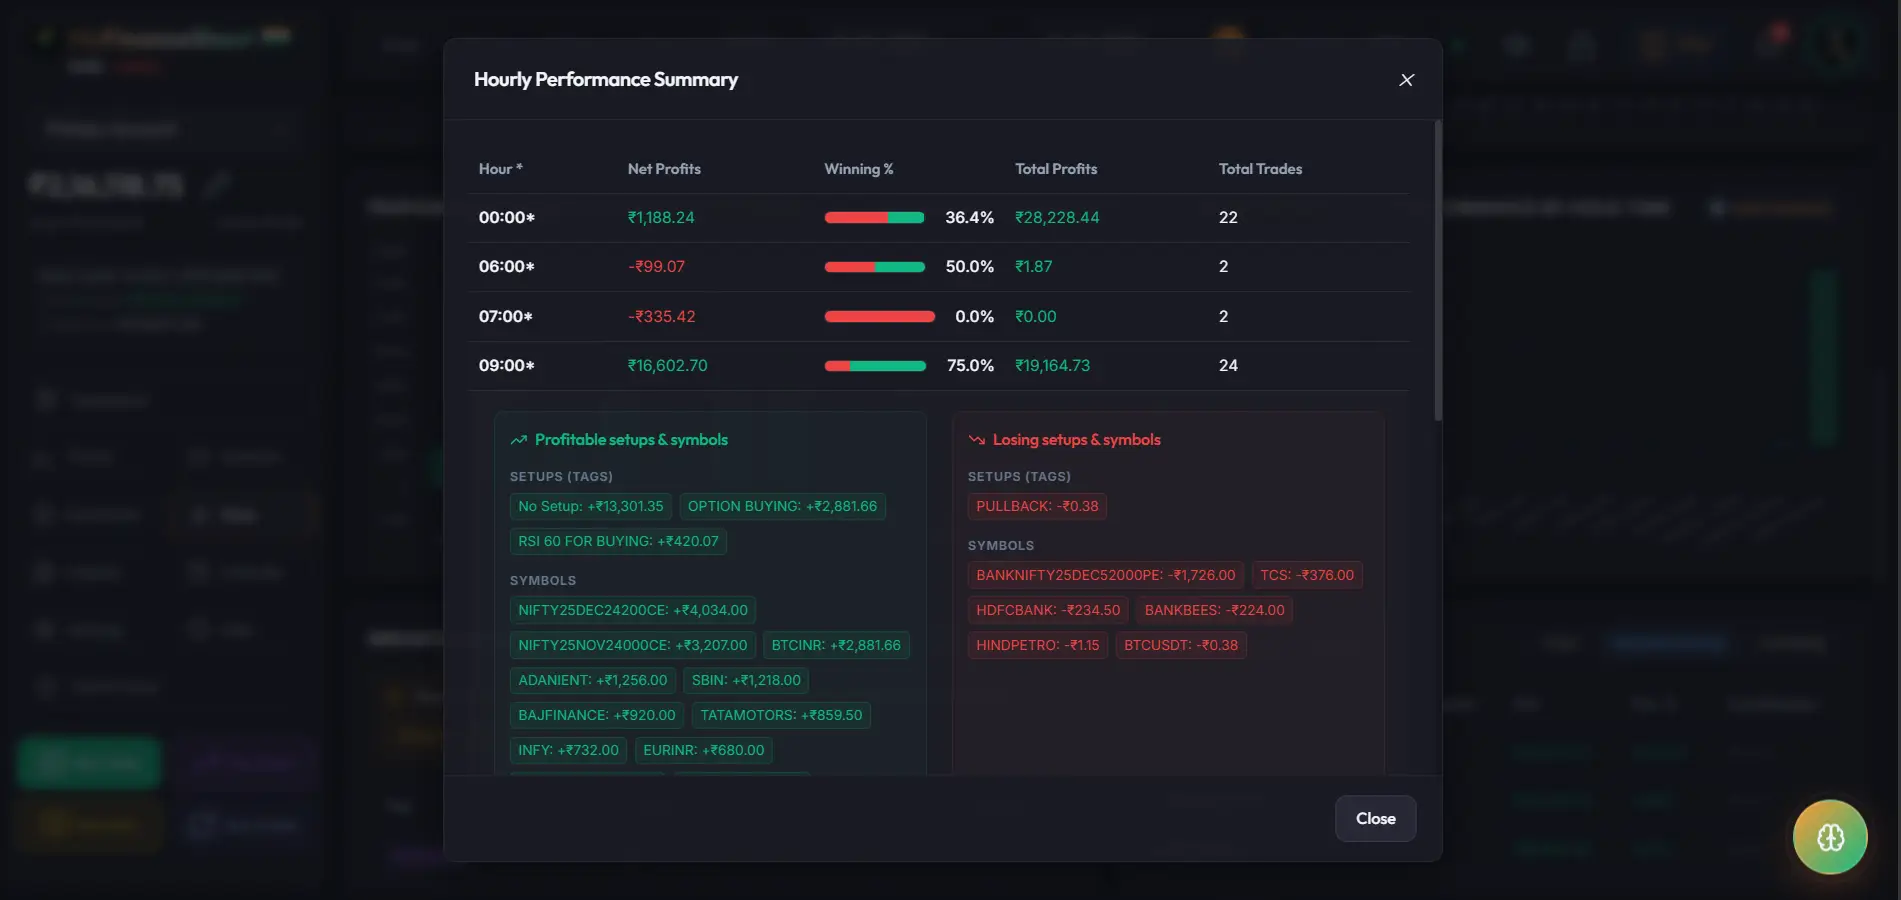
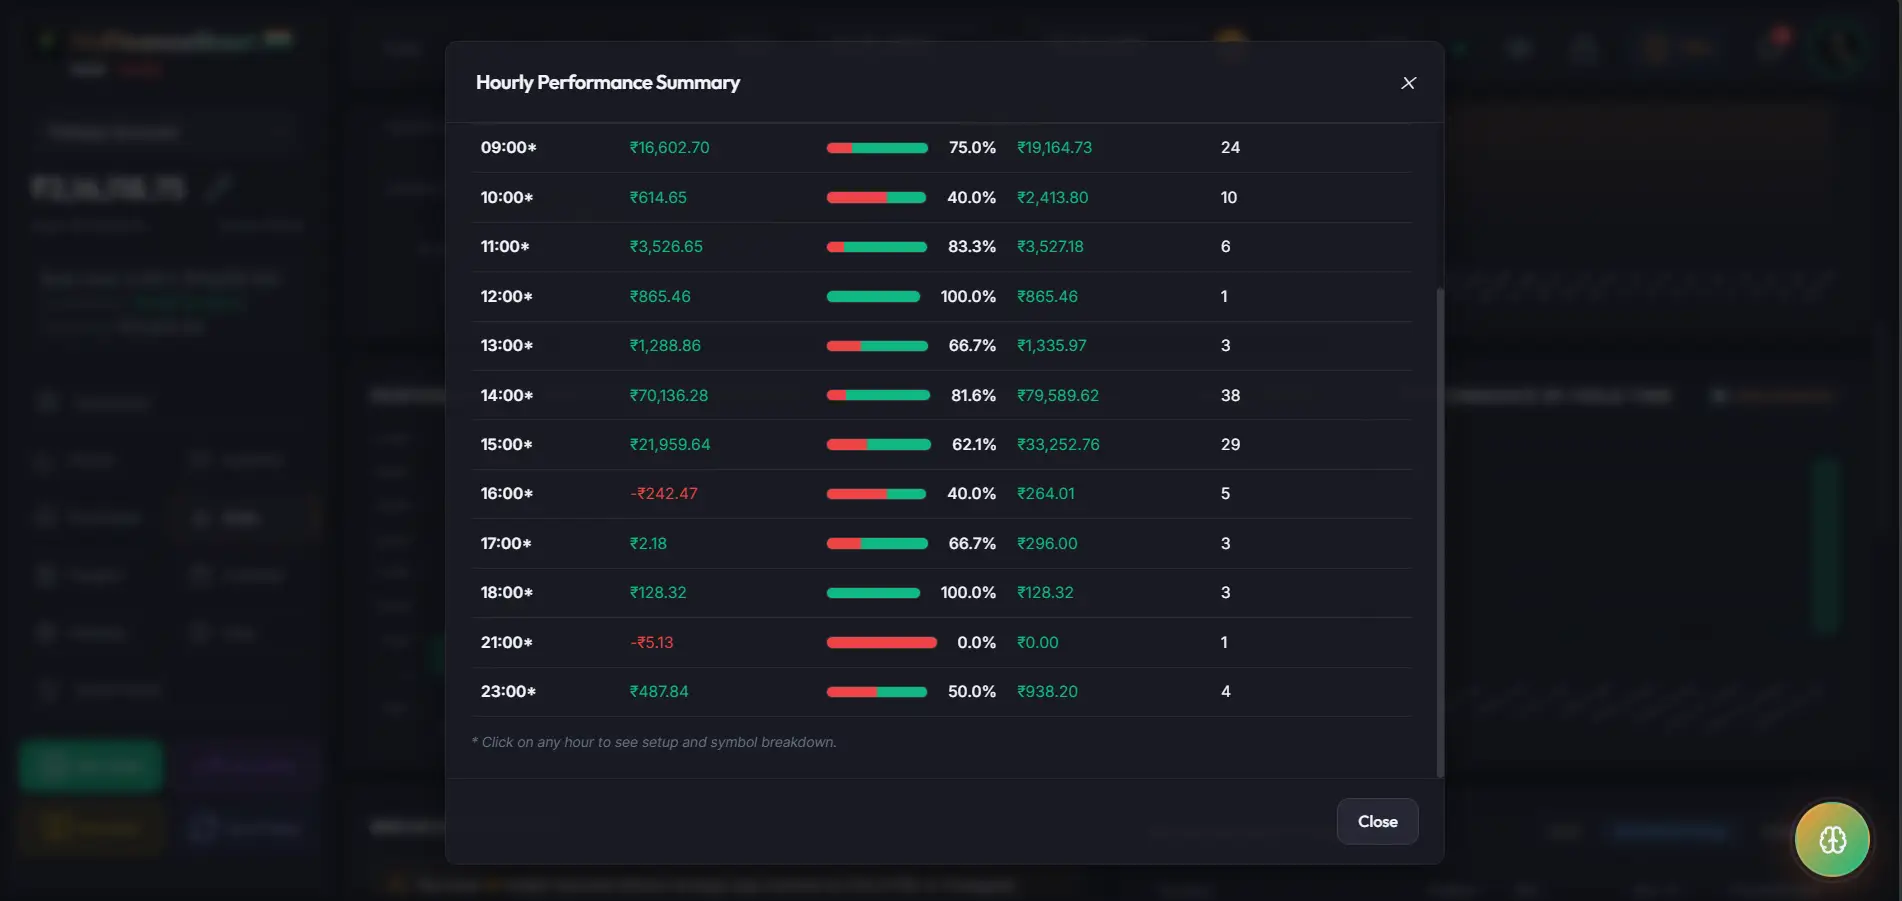
Hourly Performance SummaryHourly Performance Summary
Examine hourly performance distributions to pinpoint profitable setups and symbols. Avoid low-expectancy time slots and trade only when your setups have historical backing. Profitable setups aur symbols ko pinpoint karne ke liye hourly performance check karein. Kam probability wale time slots se bachein aur historical backing par hi trade karein.
- Hourly win rate distributionsHourly win rate distribution aur heatmaps
- Setup efficiency metrics per hourHar ghante ke setups ki efficiency aur stats metrics
- Losing symbol detection by session timeSession time ke hisab se losing symbols ka automated detection
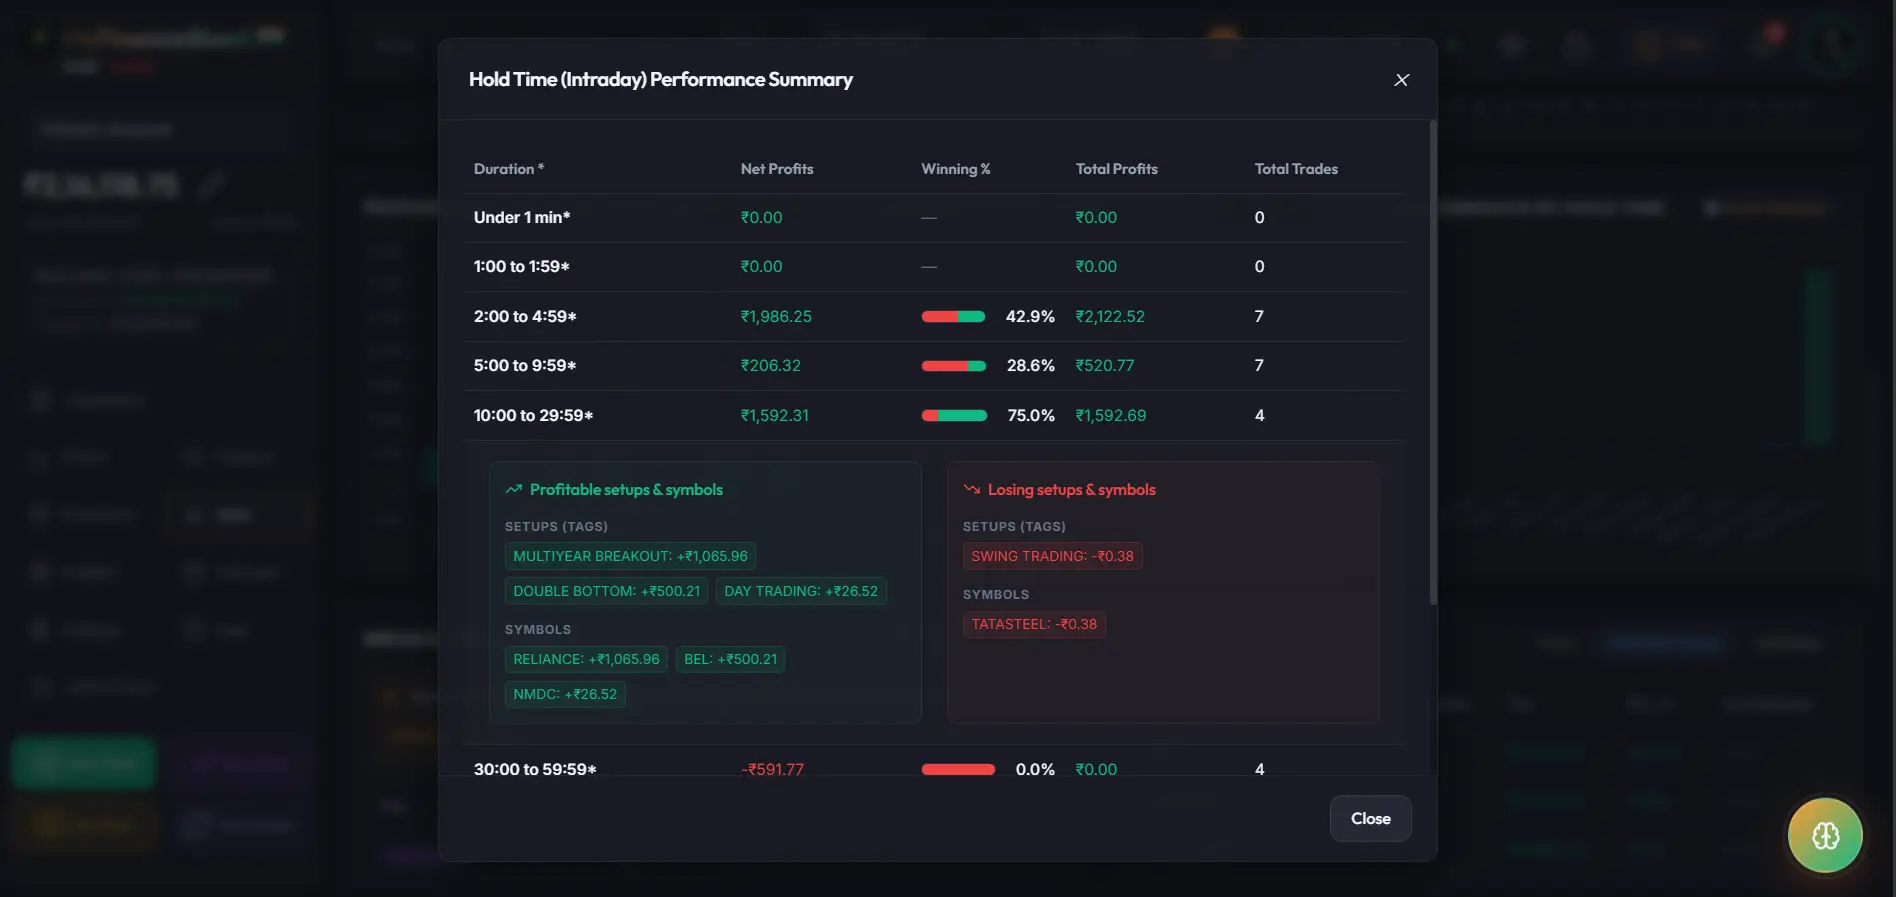
Hold Time (Intraday) Performance SummaryHold Time (Intraday) Performance Summary
Compare setup accuracy and symbol performance directly against holding durations. Fine-tune your exit targets and stop-losses to optimize scalp and intraday executions. Setup accuracy aur symbol performance ko holding duration ke sath compare karein. Scalp aur intraday trades ko exit targets aur SL se optimize karein.
- Hold time diagnostics for profitable setupsProfitable setups ke liye detailed hold time analysis
- Target and stop placement optimizationTargets aur Stop-Loss placement optimization inputs
- Isolate overholding patterns on losing symbolsLosing symbols par overholding patterns ko isolate karein
 Performance Summary.webp)
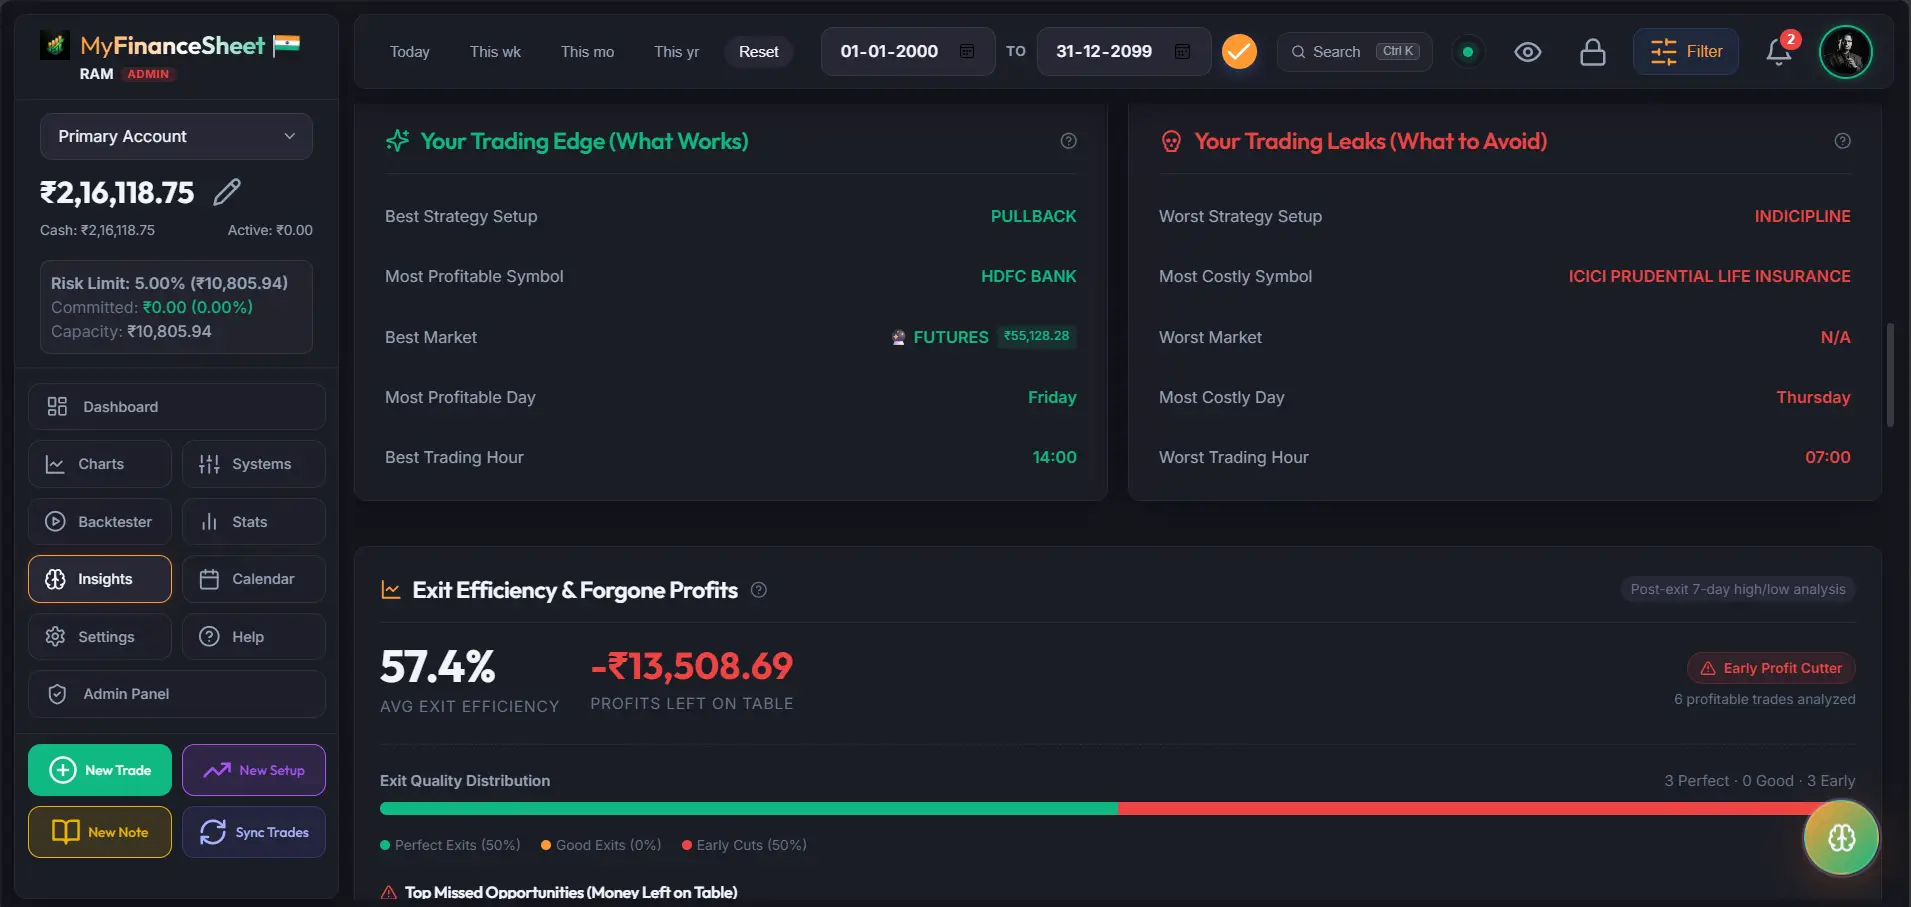
Psychological Tag Correlation EnginePsychological Tag Correlation Engine
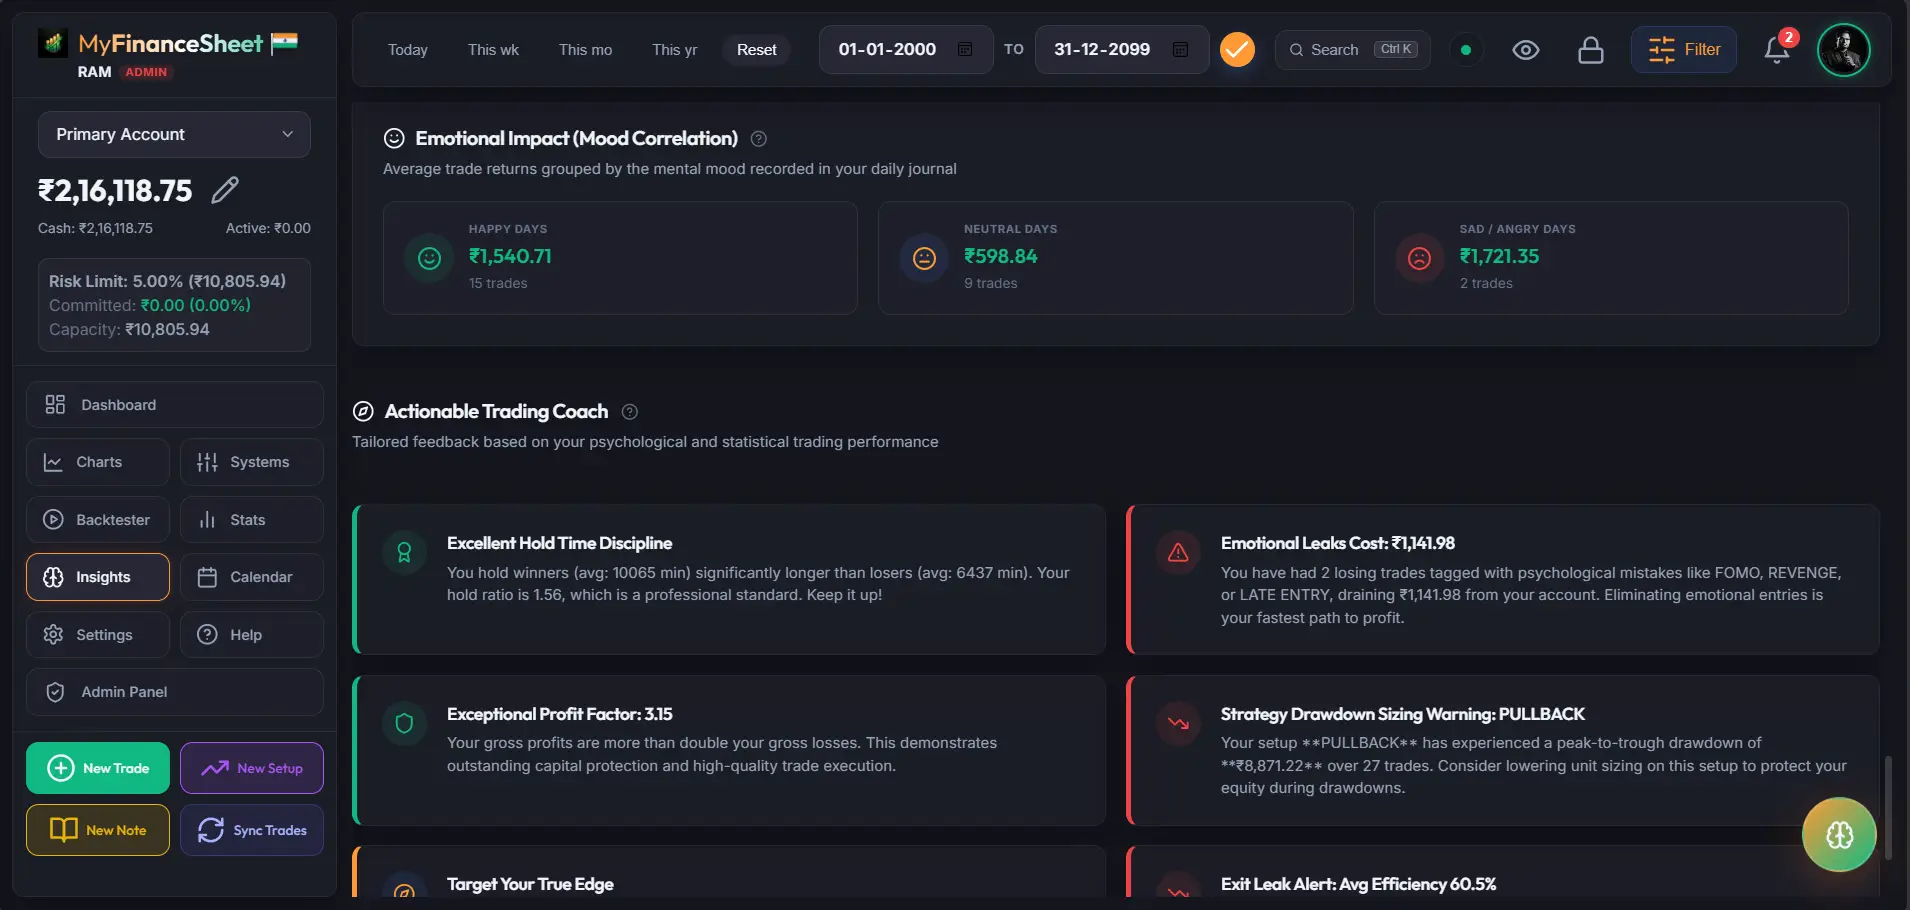
Trading is 90% psychological. Our metrics engine correlates your net profit directly with emotional tags (e.g. #FOMO, #RevengeTrading, #Disciplined) to show you the direct cost of mental leakage. Trading 90% psychological hai. Hamara engine net profit ko direct emotional tags (#FOMO, #RevengeTrading, #Disciplined) se correlate karke indiscipline ki exact cost dikhata hai.
- ROI and profit charts grouped by mental stateMental state ke according grouped ROI aur profit charts
- Clear indicators showing the exact cost of indisciplineIndiscipline se hone wale loss ki exact financial cost indicators
- Custom setups correlated with tag combinationsTag combinations aur custom setups ke correlation analytics
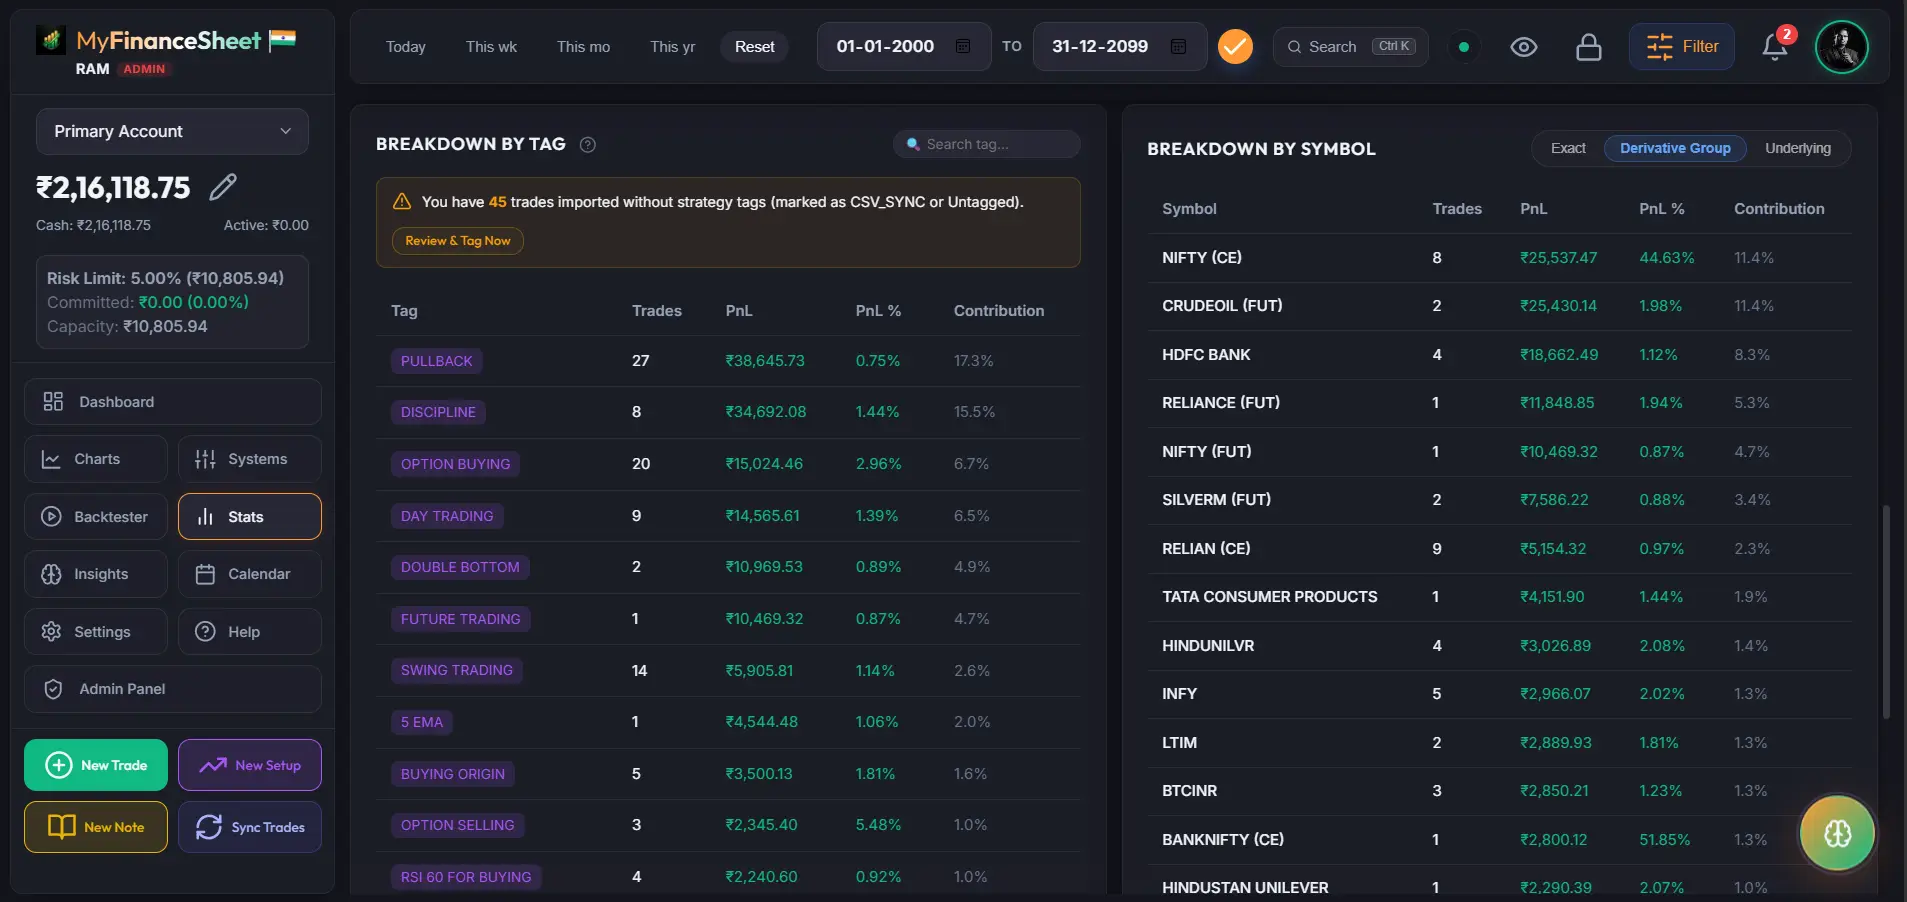
Strategy Setup Audit EngineStrategy Setup Audit Engine
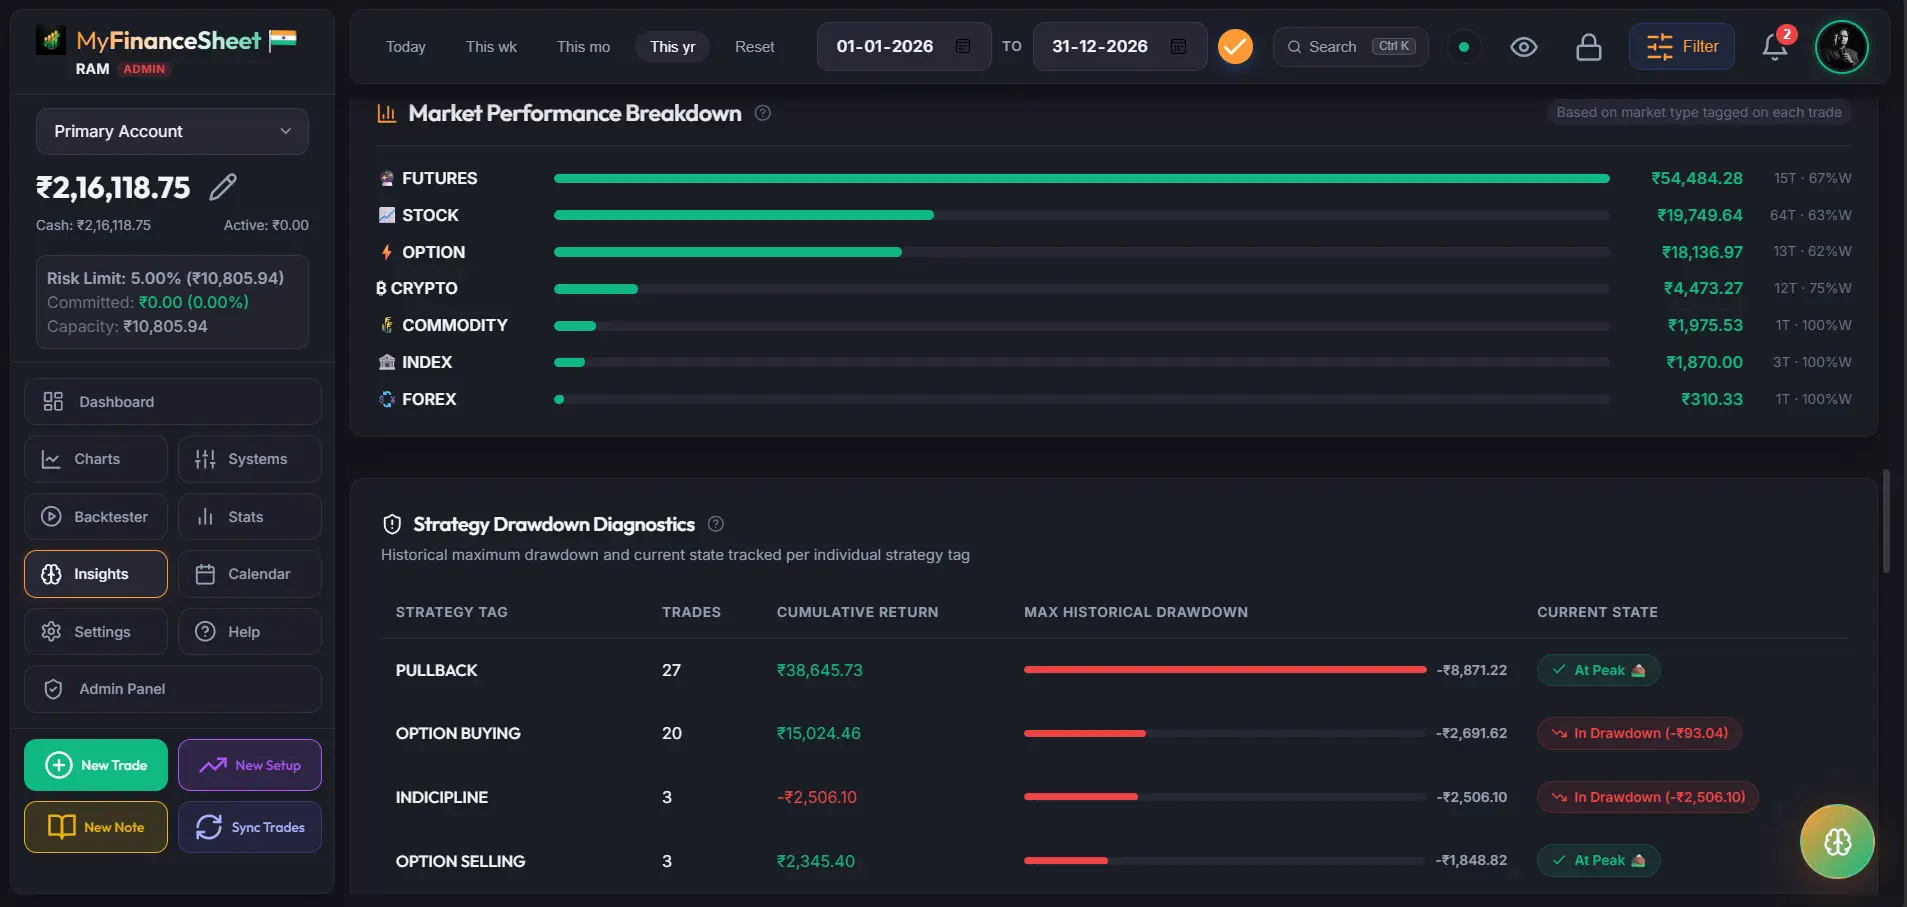
Audits your strategy setup tags (e.g. #Pullback, #Breakout, #Discipline) to uncover your optimal day execution windows, sweet spot hours, and drag tickers. Aapke strategy setup tags (#Pullback, #Breakout, #Discipline) ka audit karke optimal day execution windows, sweet spot hours aur drag tickers uncover karta hai.
- Optimal Day Window & Sweet Spot Hour auto-detection per setupHar setup ke liye Optimal Day Window aur Sweet Spot Hour auto-detection
- Top Winner Stock & Drag Ticker PnL breakdown per tagHar tag ke according Top Winner Stock aur Drag Ticker PnL breakdown
- Interactive execution log table with 1-click trade detail inspection1-click trade detail inspection ke saath interactive execution log table
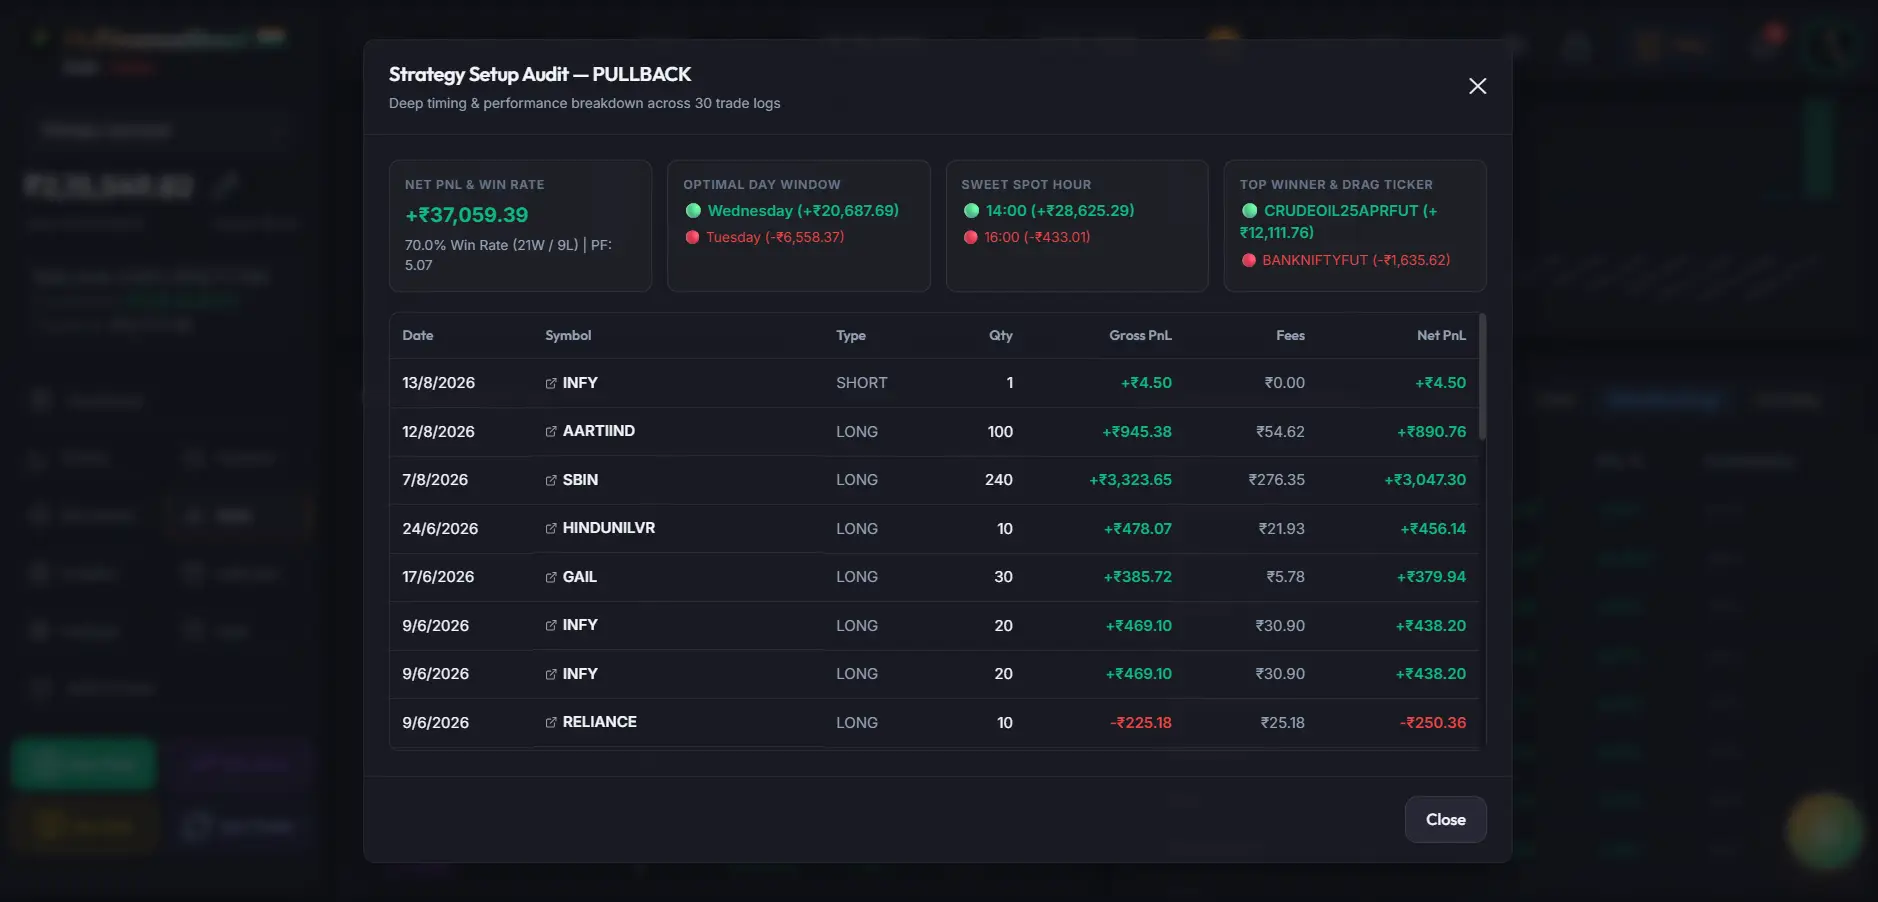
Symbol Performance Audit EngineSymbol Performance Audit Engine
Detailed ticker-level quantitative metrics that audit win rate, volume, optimal trading days, peak profit hours, and net returns across stocks and derivatives. Detailed ticker-level metrics jo win rate, volume, optimal trading days, peak profit hours aur net returns ko stocks aur derivatives me audit karte hain.
- Peak Profit Hour & Optimal Trading Day breakdown per tickerHar ticker ke liye Peak Profit Hour aur Optimal Trading Day breakdown
- 1-Click interactive technical candlestick chart jump for any symbolKisi bhi symbol ke liye 1-Click interactive technical chart jump
- Net PnL, Win Rate %, and Profit Factor metrics across execution logsExecution logs ke across Net PnL, Win Rate % aur Profit Factor metrics
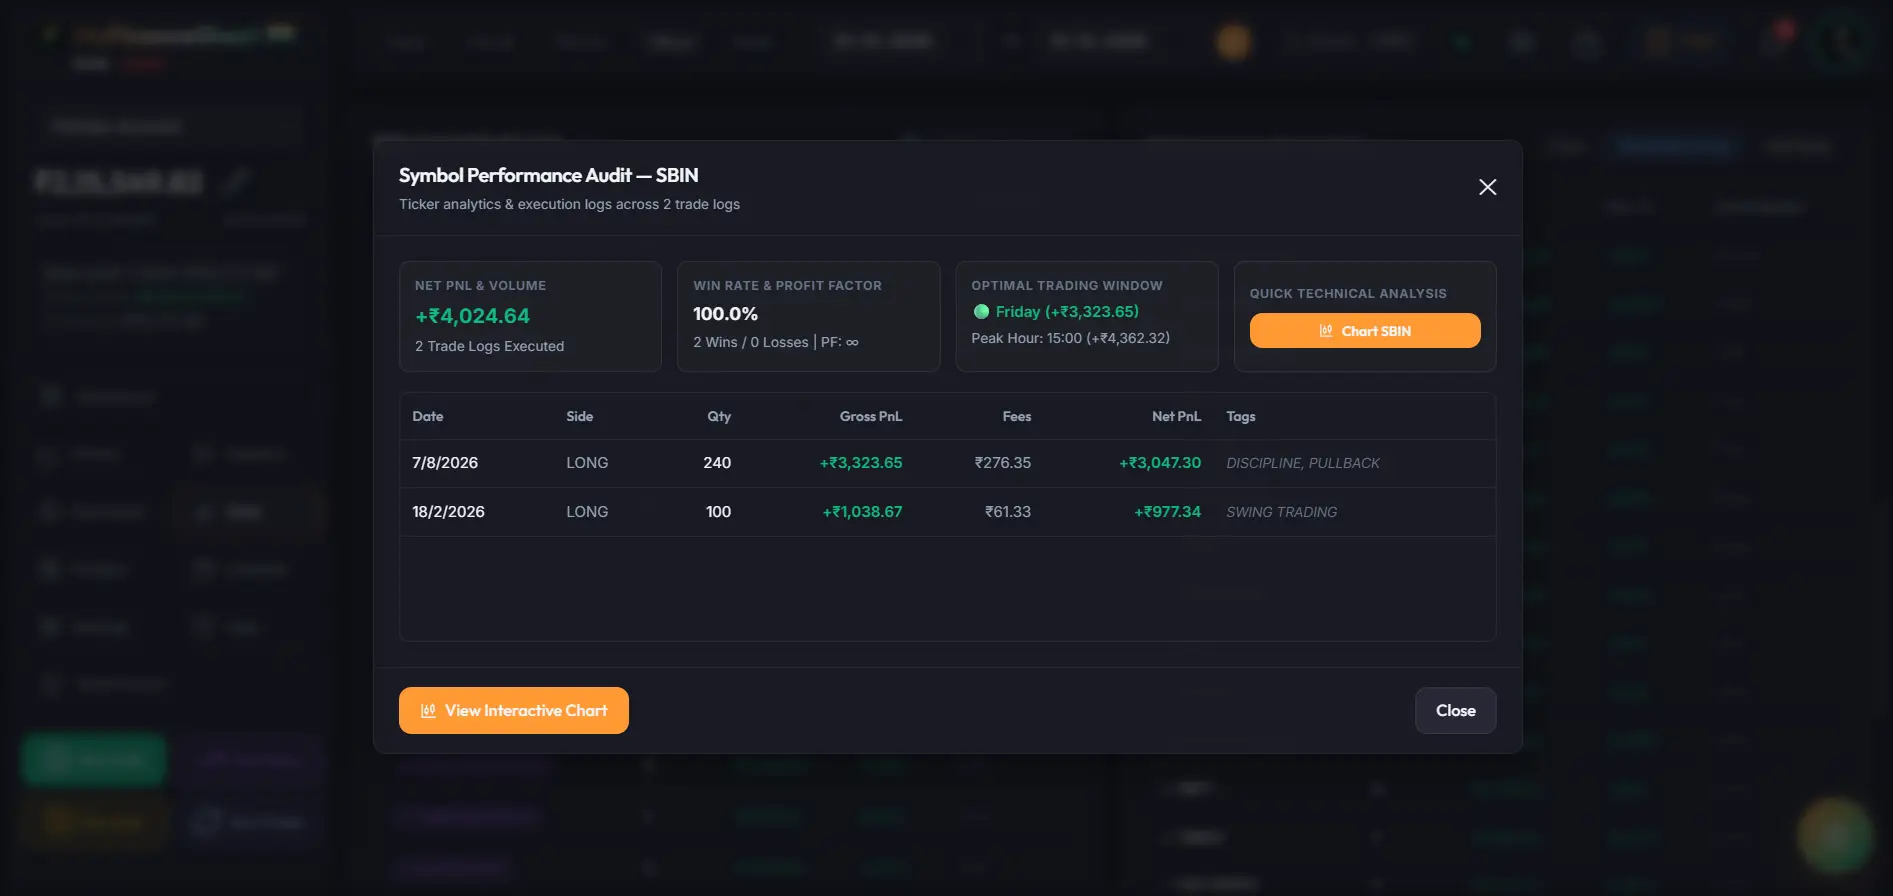
Multi-Account Status DashboardMulti-Account Status Dashboard
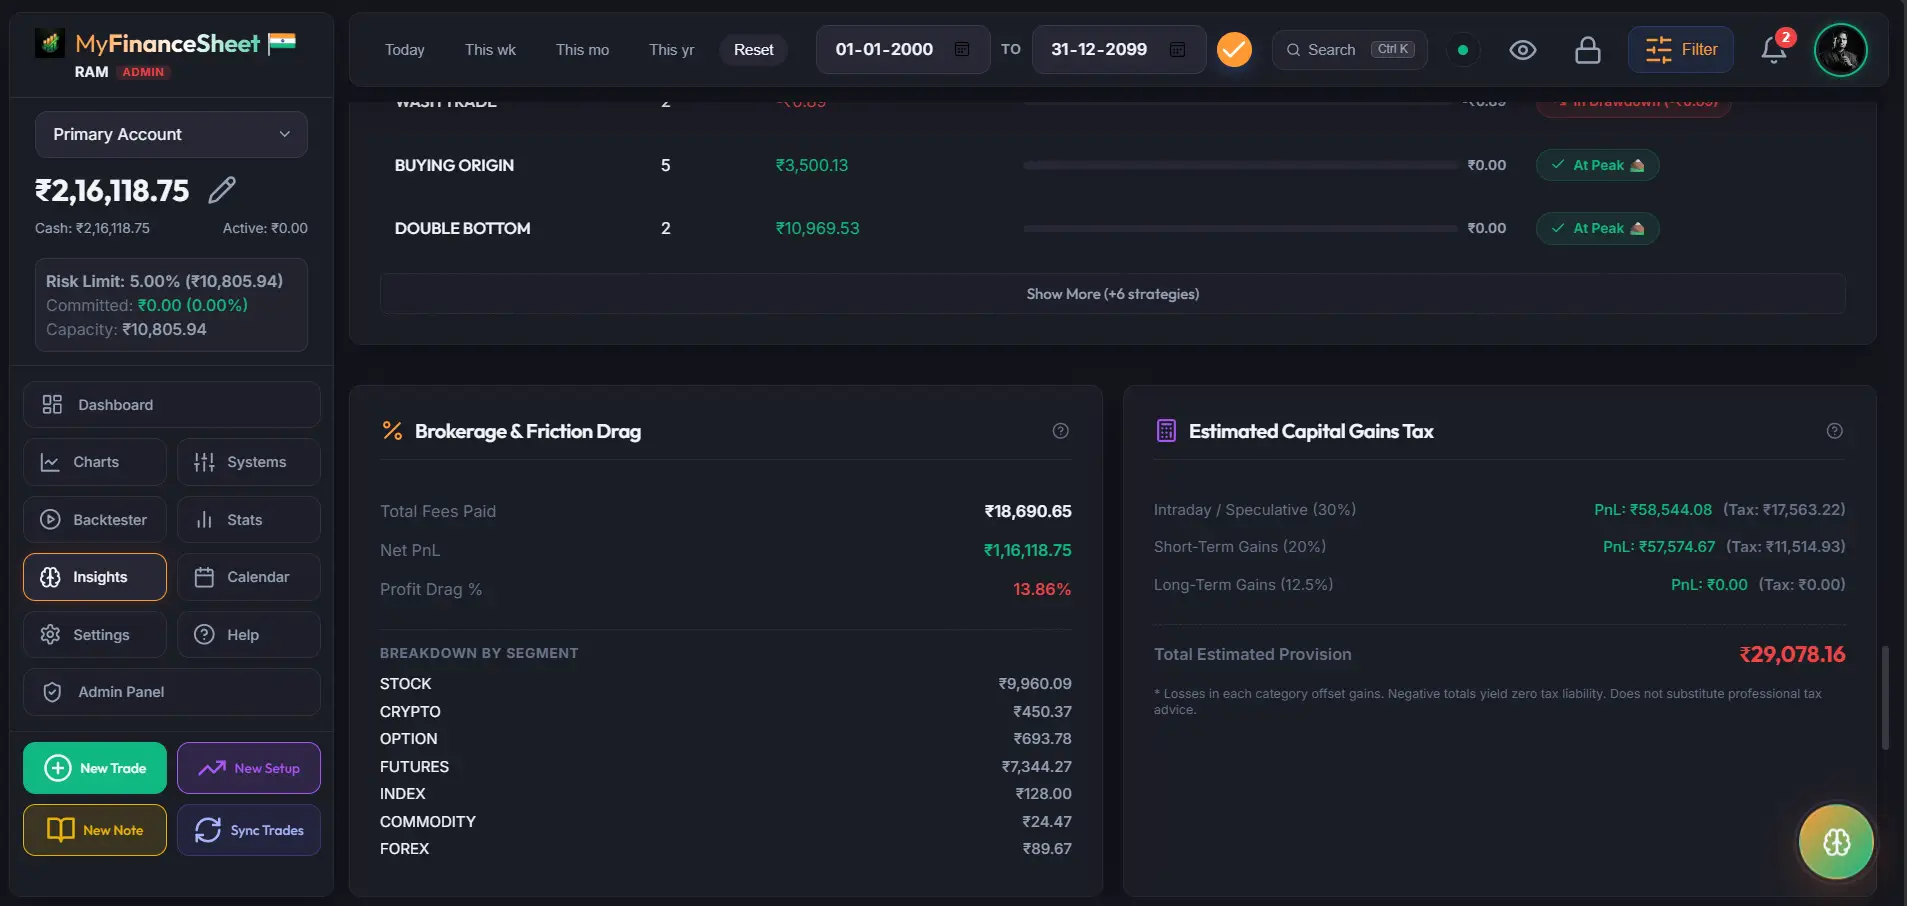
Manage all your trading accounts across multiple brokers in one consolidated dashboard. Track live connectivity status, automated sync schedules, API health, and net portfolio balances in real-time. Multiple brokers ke sabhi trading accounts ko ek consolidated dashboard me manage karein. Live connectivity status, automated sync schedules aur API health real-time track karein.
- Unified multi-broker account status & connection health overviewUnified multi-broker account status aur connection health overview
- Real-time automated sync indicators across Zerodha, Dhan, Fyers, DeltaZerodha, Dhan, Fyers aur Delta ke real-time automated sync indicators
- Single-click account switching & portfolio-wide risk status monitoringSingle-click account switching aur portfolio-wide risk status monitoring
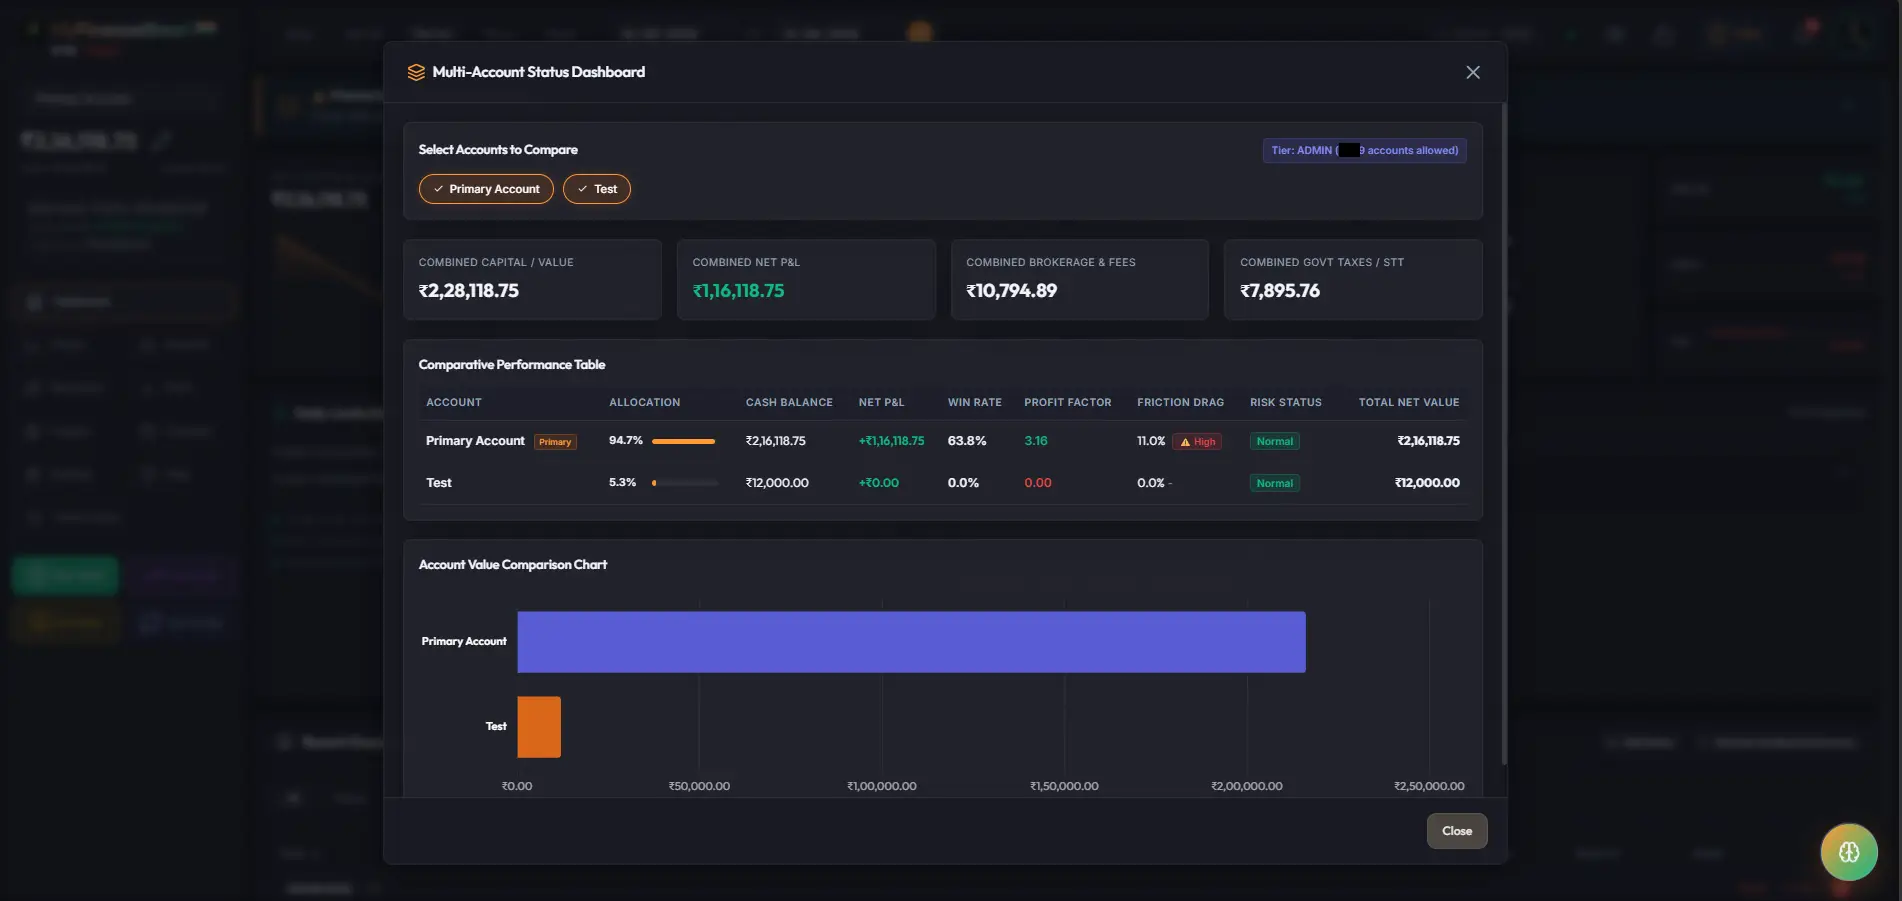
Interactive Dashboard ExplorerInteractive Dashboard Explorer
Click through the tabs below to preview the actual interface sections of the MyFinanceSheet analytics dashboard. MyFinanceSheet analytics dashboard ke actual interface sections ko preview karne ke liye niche tabs par click karein.